8. Carbon farming and voluntary carbon markets in the EU: An updated guide
Authors:
Ilaria Dibattista, Department of Political and International Sciences, University of Siena, FSR Climate, European University Institute
Mira Manini Tiwari, Department of Political and International Sciences, University of Siena, FSR Climate, European University Institute
Matteo Mazzarano, Department of Political and International Sciences, University of Siena, FSR Climate, European University Institute
Simone Borghesi, Department of Political and International Sciences, University of Siena, FSR Climate, European University Institute
8.1 Introduction
Climate change anomalies are acutely exacerbated by intensive and unsustainable human practices, foregrounded once again in the 6th IPCC report (Lee et al., 2023). Technological innovation and regulations are among the main instruments used to overcome the challenge and enable economic systems to transition to a low-carbon society. Yet, land-based sectors such as agriculture are, for intrinsic reasons, slower in finding solutions to climate change, despite their relevant mitigation potential. Land-based sectors are often tied to local communities, cultural and natural values, and their corresponding needs. The introduction of climate-resilient innovation should coexis with them. Carbon markets, which are trading systems where carbon credits are sold and bought, could satisfy such needs. It is a developing field with heterogeneous practices and definitions. In the agricultural sector, carbon markets are those markets where one side (generally land managers and agricultural firms) has the capacity to absorb greenhouse gases and offers this as a service to a buyer through so-called “carbon farming projects”. The past few years have seen a progressive development of studies on carbon farming for the European Union (McDonald et al., 2021; European Commission et al., 2021; Cevallos et al., 2019; Demeyer et al., 2021), which provide comprehensive and expert guidance on the field. Policymakers have noted the utility of carbon markets in the agricultural sector and are developing legislation to support them. The standardisation offered by such regulations reduces the asymmetries of information but can create confusion due to different definitions of similar practices across the world, as well as confusion in the objectives of carbon farming per se. For example, in December 2021 the European Commission adopted the Communication on Sustainable Carbon Cycles, aimed at promoting carbon farming and public financing, advancing the transparency of its mechanisms, and supporting landowners through consultations and help (European Commission, n.d.a). This was followed by the proposal in November 2022 on a voluntary framework for carbon removal certification (European Commission, 2022).
These recent changes have contributed to knowledge fragmentation and the coexistence of several interpretations of policies, guidelines and definitions that need harmonisation. With this chapter, therefore, we aim to integrate both well-established literature and the latest policy evolutions to create an overarching outline of all that concerns Carbon Farming (CF) and Voluntary Carbon Markets (VCMs) in the European Union (EU). The purpose of this work is to provide an up-to-date guide to support policymakers, researchers, students and interested readers in understanding the current international and European landscape.
The chapter begins by providing readers with the foundational definitions of carbon farming, carbon credits, and carbon offsets that are used throughout this chapter. Section 8.3 then traces the historical and political evolution of voluntary carbon markets, before presenting current regulation and market trends. Section 8.4 delves deeper into the main topic and sets the context of CF and emissions mitigation in the agricultural sector by presenting data on land share and emissions trends in the agricultural and other land use sectors (FAO, 2021; IPCC, 2022; EEA, 2021). Section 8.5 presents two key pieces of European regulation for carbon farming: the Effort Sharing Regulation and the proposed framework for carbon farming certification. Then, Section 8.6 takes a more practical turn by addressing the implementation and governance of VCMs, from the explanation of the main CF activities to the creation of payments for farmers, concluding with VCM types and designs. Finally, Section 8.7 collects policy and governance challenges that need to be tackled to improve the current system, both at the international and local levels. The next two sections, Sections 8.8 and 8.9 respectively, bring together policy recommendations from authorities on carbon farming in the EU and elsewhere to offer readers integrated and comparative insight, and policy implications, leaving readers with some of the evolutions, questions, and intentions that will be pivotal to VCMs going forward.
8.2 Key terms
Table 13 summarises the key definitions used in this chapter.
Table 13 Key definitions concerning carbon farming and voluntary carbon markets
| Carbon Farming | “Carbon farming refers to farm management practices that aim to
deliver climate mitigation in agriculture. This involves the management
of both land and livestock, all pools of carbon in soils, materials, and
vegetation, plus fluxes of carbon dioxide (CO2), methane (CH4), and
nitrous oxide (N2O). It includes carbon removal (sequestration and
permanent storage of carbon in soils and biomass), avoided emissions
(preventing the loss of already stored carbon), and emissions reductions
(i.e., reductions of GHGs below current levels of farm emissions). All
farming systems can mitigate, although the level of mitigation potential
differs across farm types and different geographies. Carbon farming also refers to the business model that aims to upscale climate mitigation by paying farmers to implement climate-friendly farm management practices. Funding can come from public funds such as the [European Union’s] Common Agricultural Policy, or private sources via supply chains or carbon markets. These different funding sources offer different opportunities and risks for farmers and for delivering on climate objectives.” (McDonald et al., 2021, p. 7) |
| Carbon credit | The acquisition and possession of a unit or carbon removed, avoided, or reduced constitutes a carbon credit if it can be accounted for under national emissions mitigation commitments or on the market. A carbon credit constitutes one tonne of CO2 or equivalent greenhouse gas (1 t CO2e). |
| Carbon offset | When a unit of carbon mitigation (removal, avoidance, or reduction) is bought and accounted for by another actor, the unit becomes carbon offset. The buyer seeks to use the carbon mitigation activities of the original actor to ‘compensate for’ their own GHG emissions. |
| VCMs | Markets on which carbon credits are traded. |
| Double counting | Instances in which a carbon credit is accounted for in more than one jurisdiction or towards more than one actor’s obligations or goals. |
8.3 Evolution of carbon credits and voluntary carbon markets
8.3.1 From compliance credits to voluntary carbon credits
The concept of carbon credits partially has conceptual origins in the discourse of payments for ecosystem services (Brunori, 2023; Kotsialou et al., 2022), namely the act of assigning economic value to an environmental resource or outcome. These credits exist in both the public and private sectors. In the public sector (including both transnational entities, such as UN mandates and national governmental systems), credits are often referred to as compliance credits, given their purpose of enabling actors’ compliance with carbon mitigation obligations.
Compliance credits have their roots in a transnational mechanism established under the 1997 Kyoto Protocol that concerned two types of countries: Annex I countries were required to set greenhouse gas emissions reductions; Annex II countries were exempted from these requirements, invoking a rationale of being “too poor to be green”. However, since the implementation of GHG emissions mitigation was often more cost-effective in Annex II countries compared to Annex I, the United Nations Framework Convention on Climate Change (UNFCCC)[1] implemented the Clean Development Mechanism (CDM) as part of the Kyoto Protocol, under which Annex I countries can implement emissions reduction projects in Annex II countries. The projects’ outputs are quantified in terms of Certified Emissions Reductions (CER) credits, which can be sold and can be counted towards emissions reduction or limitation commitments under the Kyoto Protocol. Joint Implementation (JI) projects allow two Annex I countries to collaborate in emission reduction projects. Emission reductions or limitations achieved in one country can be bought by another, in the form of Emission Reduction Units (ERUs), which can be counted towards the buyer’s national Kyoto Protocol commitments. Both mechanisms are designed to give flexibility to polluting countries while they improve their mitigation capacity.
Given the unprecedented nature of this tool, the CDM set commitment periods at the end of which targets, and the market were to be evaluated. Running parallel to the evolution of the CDM, from the late 1990s and early 2000s onwards, governments, NGOs, and private companies began to develop markets to incentivise mitigation measures (Nogues et al., 2021). Market policies for reaching the Kyoto Protocol’s targets have been adopted throughout the world (Tang et al., 2016), with the 2005 EU Emission Trading System (ETS) being the world’s first international example. As part of this shift, voluntary carbon credit registries came into existence, with key actors including the American Carbon Registry (ACR), GoldStandard, and Verra, formed by coalitions of businesses and international environmental organisations, ranging from the WWF (in the case of GoldStandard) to the non-profit Winrock (in the ACR).
The CDM commitment period ending in 2012 brought uncertainty for CDM credit holders, leading to a significant shift of actors from the compliance arena towards the voluntary arena (Spilker and Nugent, 2022). However, this shift also entailed greater fragmentation, which in turn brought its own opacity. To improve transparency and certainty, in 2015, the Paris Agreement explicitly institutionalised the exchange of carbon at the market level. It recognised the role of markets in enabling international cooperation on emissions reduction to comply with the newly introduced Nationally Determined Contributions (NDCs), which are binding national commitments to reduce greenhouse gas emissions. This saw the introduction of Internationally Transferred Mitigation Outcomes (ITMOs), which are none other than ‘credits’ in the UNFCCC context. These ITMOs were to be validated by Corresponding Adjustments (CAs), a centralised mechanism to ensure that a mitigation outcome acquired by a state is accounted for only within their NDCs, and not also counted towards the NDCs of the state that hosts the carbon mitigation project (Spilker and Nugent, 2022). In other words, corresponding adjustments are designed to avoid double counting. However, both verification and certification for CAs are conducted by UNFCCC committees. Despite its authority and consistency, the fact that a single body is performing both results in an opaque system of transactions and measurements (Roman-Cuesta and Borghesi, 2022). A key consequence of this opacity has been the inability of users to reliably track the prices and transactions on the market. In recent years, the transnational Certified Emissions Reduction compliance mechanism has been substituted by national programmes and private international initiatives. Indeed, CDM credits were excluded from the EU’s ETS on the grounds of environmental inefficacy and to avoid CDM credits driving down ETS prices.
8.3.2 Turning points in VCM structures
VCMs differ significantly from ETSs at the structural level: actors earn revenue (through carbon credits) for reducing or sequestering carbon emissions, “relative to a counterfactual baseline,” instead of paying for their emissions (“i.e., the polluter pays principle”) (World Bank, 2022, p. 13). Voluntary carbon markets responded to the mandate for carbon mitigation and trading, created by the compliance system (Miltenberger et al., 2021; Ahonen et al., 2022; Streck, 2021; Hickman, 2016). In doing so, VCMs brought the potential to reach a wider range of actors and increase both carbon mitigation and other positive environmental outcomes (Ahonen et al., 2022). While compliance markets are strictly for emissions mitigation, voluntary markets ‘reward’ the achievement of other goals beyond carbon mitigation, such as biodiversity outcomes (Roman-Cuesta and Borghesi, 2022). These other goals have been formalised in certifications such as Verra’s Climate, Community and Biodiversity (CCB) standards: as with carbon credits, they have put an economic value on often marginalised outcomes, but their complexity and fluidity have rendered these valuations particularly susceptible to inaccuracies or fraud, as will be discussed later in the chapter.
An important innovation in the Paris Agreement is Article 6, which recognises the use of carbon credits, not only between nations but also with private actors, to meet states’ NDCs, including for activities beyond emissions reductions. The expansion of VCMs and the prospect of them contributing to national carbon mitigation goals has led to a crucial regulatory requirement, which has yet to be concretised: a global carbon emissions accountability mechanism that addresses the relationship between voluntary carbon mitigation, and national and global targets. VCM bodies are therefore largely in agreement that specific labels certifying corresponding adjustments (CAs) and Article 6 compatibility are necessary (Gold Standard, 2021; Verra, 2021), but there is no consensus yet on whether these should be mandatory (Ahonen et al., 2022; TSVCM, 2021; Kreibich and Hermwille, 2021).
Kreibich and Hermwille (2021) claim that integration between VCMs and Article 6 should indeed be mandatory, arguing that, to maintain the environmental integrity of carbon offset credits being used to achieve carbon neutrality, the offset must be registered within the project’s host country’s NDC, necessitating an integration of CAs. Without this structure, they warn that the market risks a ‘race to the bottom’ for the cheapest projects, with key social and environmental implications discussed later in this chapter. They further note that the CAs, in turn, would need to be aligned in order to avoid creating heterogeneous levels of liquidity between credits. Article 6-compliant credits would likely have stringent regulations, such as not including activities that are required by the law or that would already be economically possible/feasible (Ahonen et al., 2022).
While voluntary systems enable exchange between private actors, and international systems (like the CDM or the EU’s Emissions Trading System (ETS)) enable exchange between states, no structure currently exists to enable exchanges between these two types of actors in a reliable and consistent manner, leaving the risk of double counting (TSVCM, 2020) very much intact, particularly between a private actor and a host country. However, compliance and voluntary credits are not, by default, mutually exclusive: GoldStandard includes credits that are CDM-recognised (CERs) as well as voluntary ones (VER), and Verra’s Verified Carbon Standard accepts CDM methodologies (Ahonen et al., 2022; Roman-Cuesta and Borghesi, 2022). At COP26, it was decided that some CDM credits were eligible for helping countries to meet their first NDC targets (World Bank, 2023). At the state level these shifts are highly heterogeneous, with some states expanding the inclusion of carbon credits in their compliance systems, and others limiting them. While private buyers rely heavily on the VCM, the supply side of carbon credits still lacks a common position (Kreibich and Hermwille, 2021).
8.3.3 Market trends
2021 saw the largest annual growth in carbon credits since 2012, a 48% increase on 2020, with both growth and absolute volumes dominated by independent crediting mechanisms (as distinct from national or international mechanisms) (Graph 5) (World Bank, 2023). In 2021 credits issued by independent standards rose by 88%, constituting 74% of the year’s total credit supply, while CDM issuances rose by 25%, constituting 11% of total issuances (World Bank, 2022). However, this changed in 2022, which saw a 22% drop in carbon credits issued by independent mechanisms. Conversely, there was growth in the demand for and issuance of compliance credits, and the creation of domestic and international mechanisms in which to use them, potentially driven by progress in negotiations on compliance credits at the COP conferences (World Bank, 2023).
Graph 5 Global volume of issuances by crediting mechanism type (2018-2022).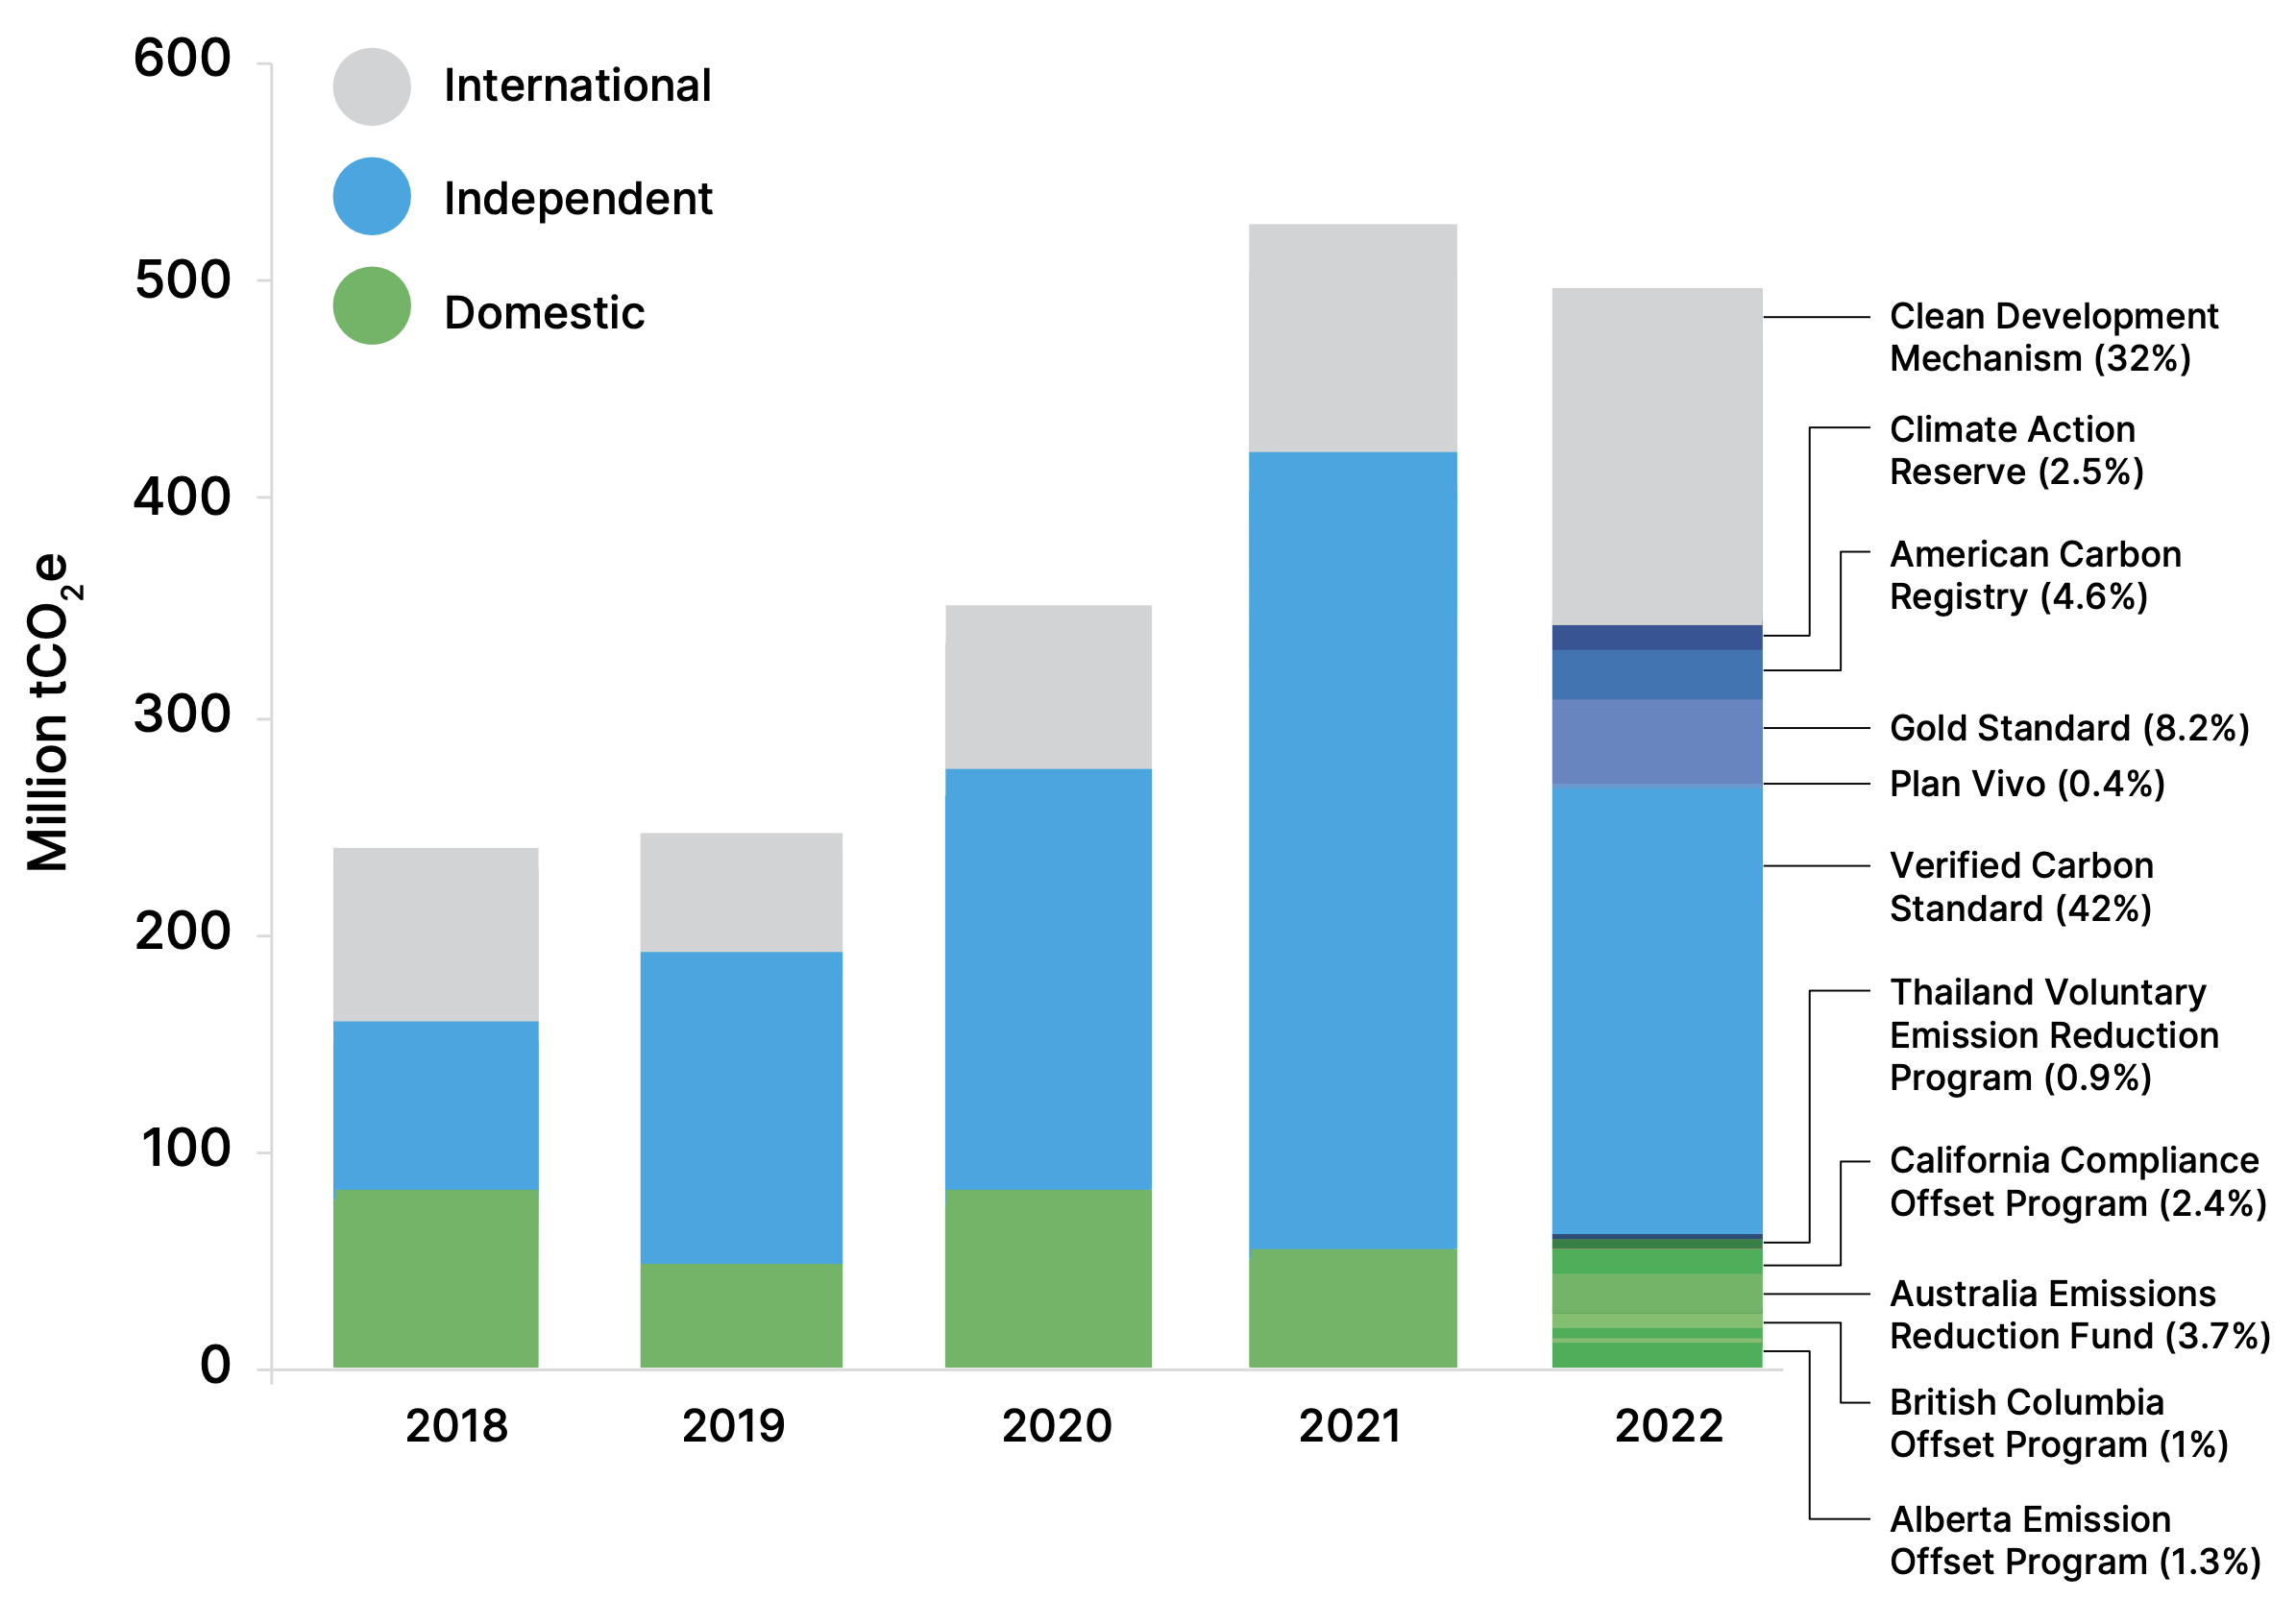
Source: World Bank (2023)
The demand for voluntary carbon credits is predominantly driven by corporate net zero commitments (energy; food, beverage, and tourism; consumer goods companies, and financial actors) (World Bank, 2022). Corporate ambitions, expectations of alignment between compliance and voluntary markets, and expanding technologies and nature-based solutions led to predictions of high growth in demand for carbon credits: a 15-fold increase by 2030 and a 100-fold increase by 2050, to reach 1.5-2GtCO2 and 7-13 GtCO2 per year respectively (World Bank, 2022). As shown in Graph 5, these predictions have not manifested immediately. 2022 saw a fall in both issuances and retirements of carbon credits. The annual World Bank report, State and Trends of Carbon Pricing 2023, proposes the following potential reasons for this drop: wider macroeconomic conditions resulting from global crises, renewed and tangible critiques of the efficacy of carbon credits, and administrative obstacles in verifying new projects and credits (World Bank, 2023).
Most voluntary carbon removals and reductions come from forestry and renewable energy respectively (Graph 6). Renewable energy has historically dominated carbon credit supply and continues to do so (constituting 55% of credits issued in 2022, and 45% of registered projects) (Ecosystem Marketplace (2022) in World Bank (2023)). However, falling costs of renewable energy are making it increasingly affordable without carbon credits. This means that renewable energy projects may no longer meet the financial additionality criterion for carbon credits, and indeed some mechanisms, such as GoldStandard and the Verified Carbon Standard are already phasing out credits on renewables, allowing only those projects in least developed countries (World Bank, 2023).
Graph 6 Percentage of total issuance by project category and year.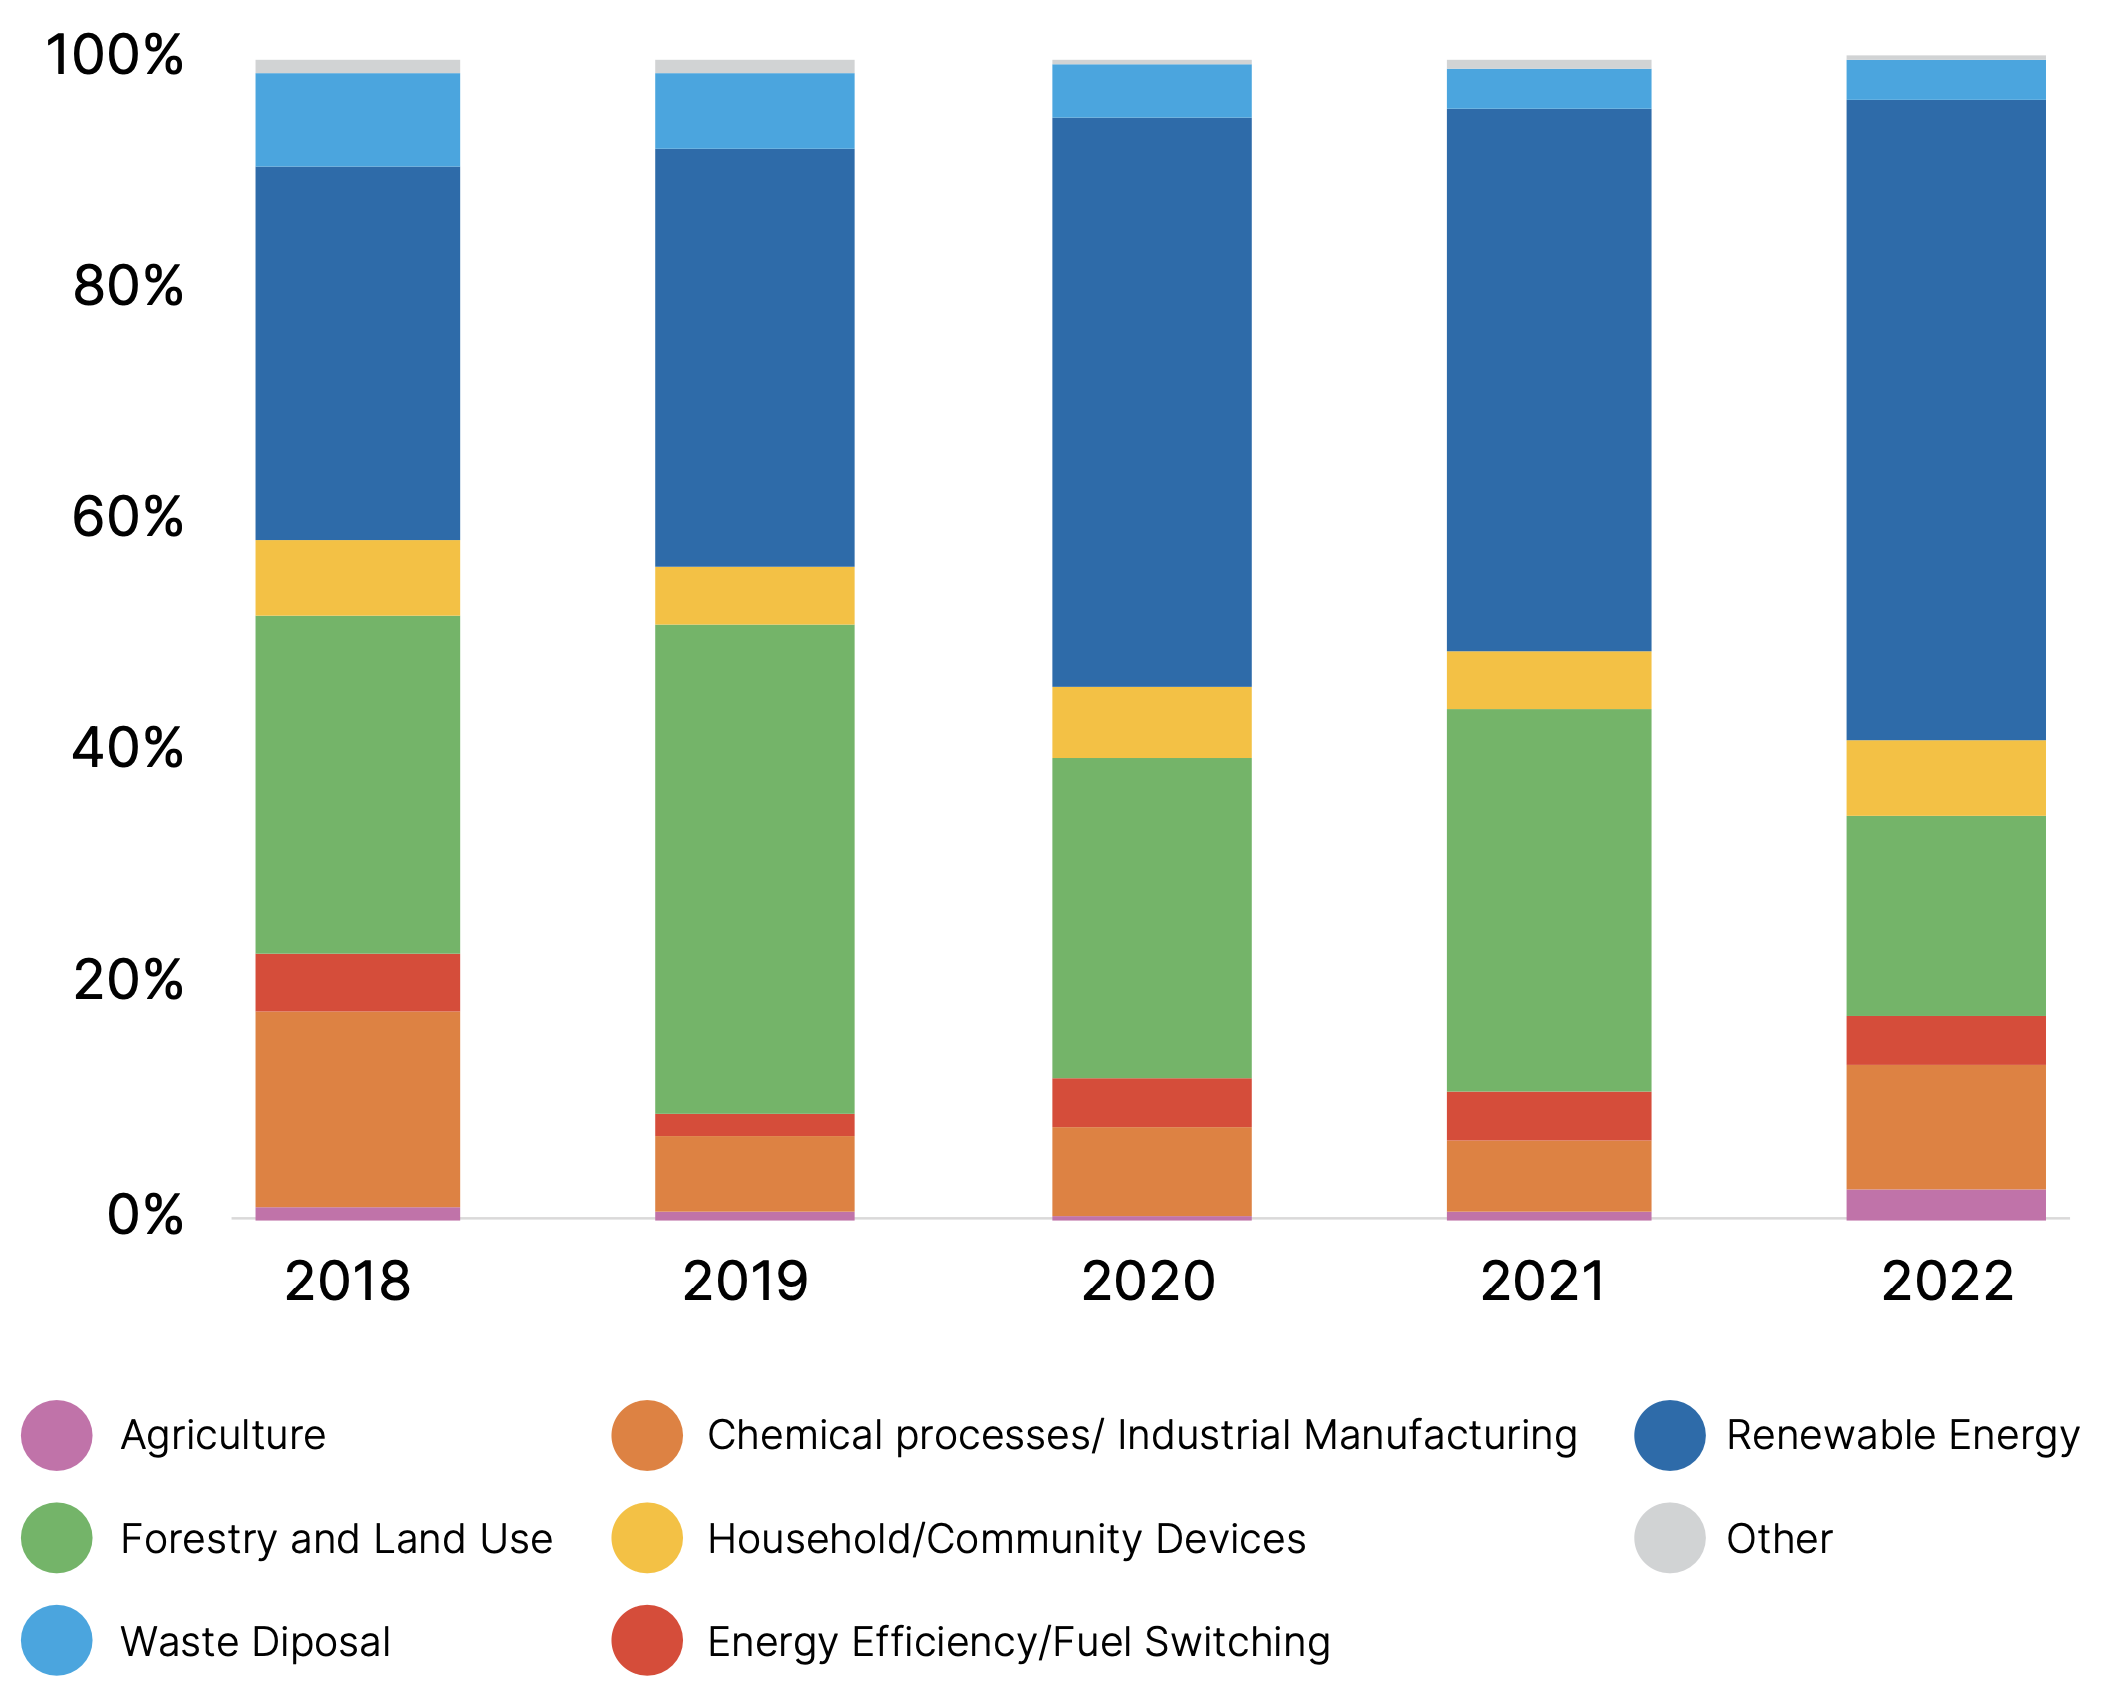
Source: Ecosystem Marketplace data (2022) in World Bank (2023)
The Task Force on Scaling Voluntary Carbon Markets (TSVCM) (2021) report, too, predicts that nature-based solutions (both avoidance and sequestration) will dominate future supply. Verra’s voluntary carbon credit issuances, for instance, are led by AFOLU credits and within that by REDD+ projects (Reducing Emissions from Deforestation and Forest Degradation in Developing Countries, plus the benefits of conservation, sustainable forest management, and carbon stock measurement) (Roman-Cuesta and Borghesi, 2022). However, despite this growth in demand, in 2022 retirements (i.e., ‘accounting’) of nature-based carbon credits fell from 36% to 23% from 2021 (World Bank, 2023). A key factor, discussed in section 8.7.5, will be the integrity of nature-based credits, as revelations around the inaccuracies and inefficacies of several nature-based projects may have been behind the fall (World Bank, 2023).
Turning specifically to the agricultural sector, the Voluntary Carbon Market Dashboard on nature-based solutions (Graph 7, last updated on 4 May 2023) indicates a relatively small current share of projects and credits issued for carbon sequestration in the agricultural sector and reduced emissions in the agricultural sector. The dominance of forest measures (afforestation, reforestation, and forest management) aligns with the global and European data on emissions reduction trends described in Section 8.4. While the majority of projects are based on carbon removal, most credits issued rely on emissions avoidance. A potential reason might be the long-term nature of carbon removal technologies and the time needed to develop the appropriate measurement and certification methods. If so, this could signal an upcoming growth in credits issued for carbon removal. Secondly, avoidance projects might enable greater scale (through large-scale conservation projects) that result in a greater number of credits from a smaller number of projects.
Graph 7 Overview of nature-based solutions. Source: Bravo and Mikolajczyk (2023)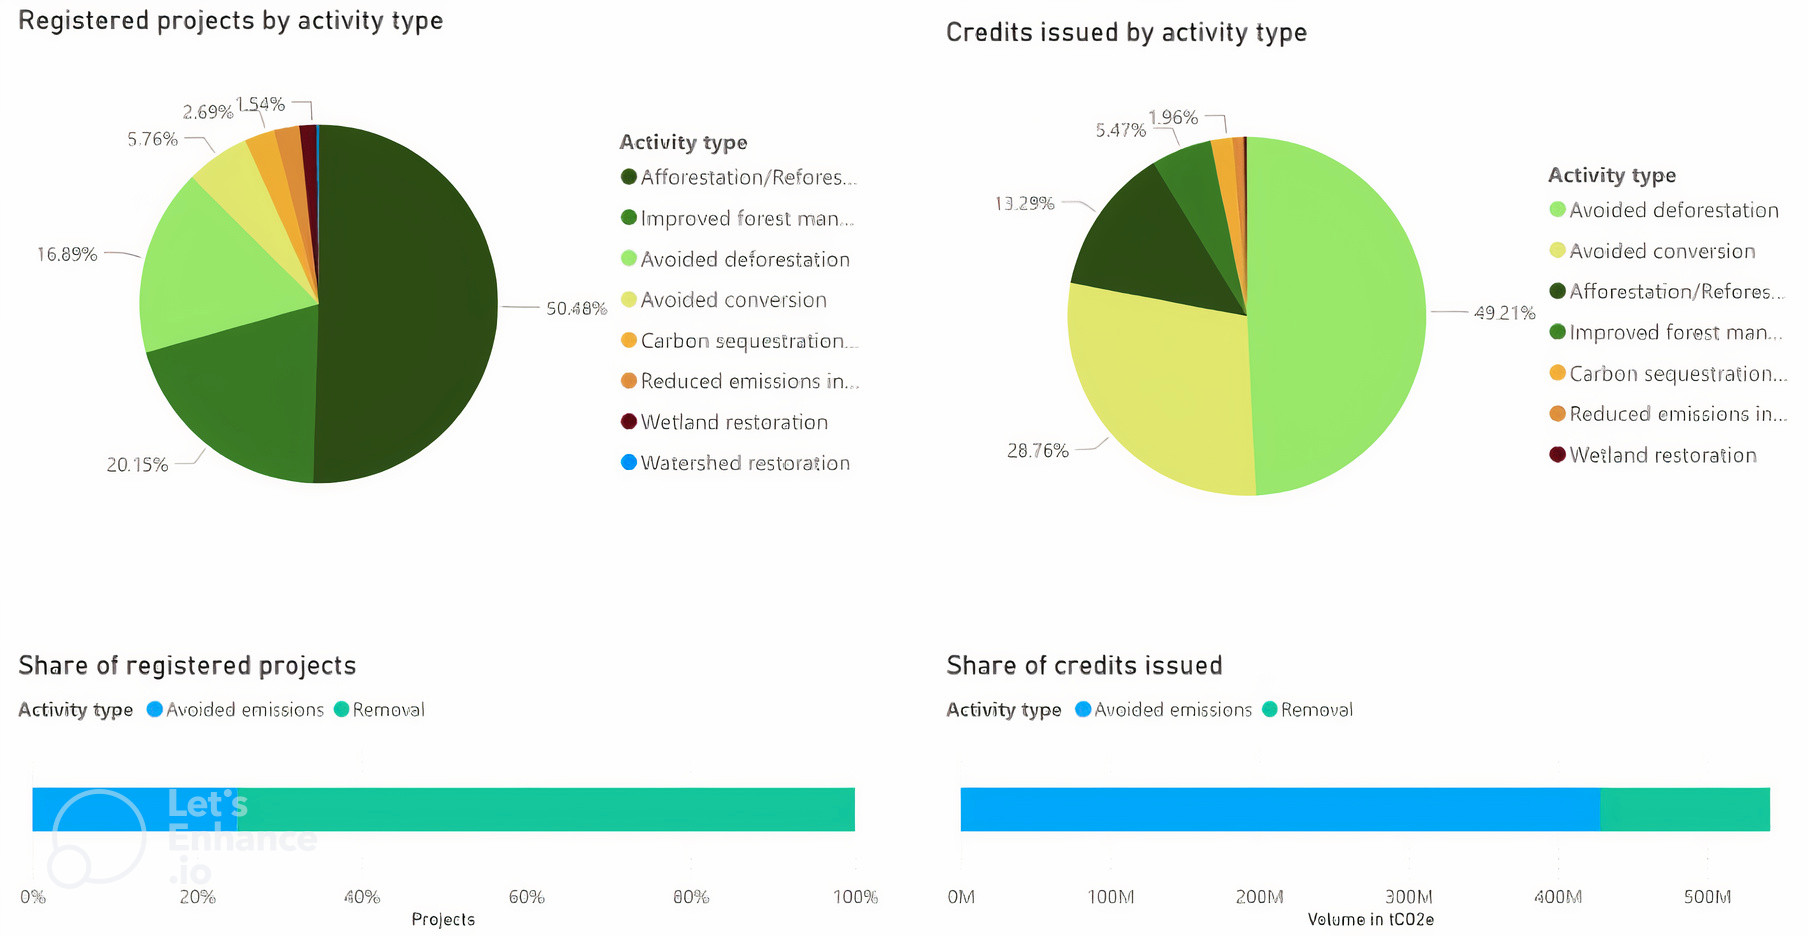
What is certain after this analysis is that the agricultural sector and nature-based solutions will play a major role in climate change mitigation in the following years, but this will happen only in conjunction with technologies and policies that will guide the sector. Indeed, as discussed in the following section, the contributions of the agricultural sector are still insufficient to be considered effective and thus need further attention and transversal efforts and VCMs can contribute to reducing the costs of climate mitigation activities.
8.4 Emissions and mitigation in the agricultural sector
8.4.1 Global
In 2018 emissions from the agricultural sector and related land use constituted almost a fifth (17%) of global greenhouse gas (GHG) emissions, according to statistics by the UN’s Food and Agriculture Organisation (FAO, 2021)[2], marking a fall of 7% since 2000. This fall in the share of global emissions generated by the sector is predominantly (>80%) due to a fall in deforestation (high IPCC confidence), which accounts for 45% of Agriculture, Forestry and Other Land Use (AFOLU)[3] emissions (Nabuurs et al., 2022). The changes in the sector’s respective responsibility is also explained by the faster emissions growth of other sectors (FAO, 2021).
Graph 8 Changes in non-CO2 emissions from crops and livestock activities, 2000-2018.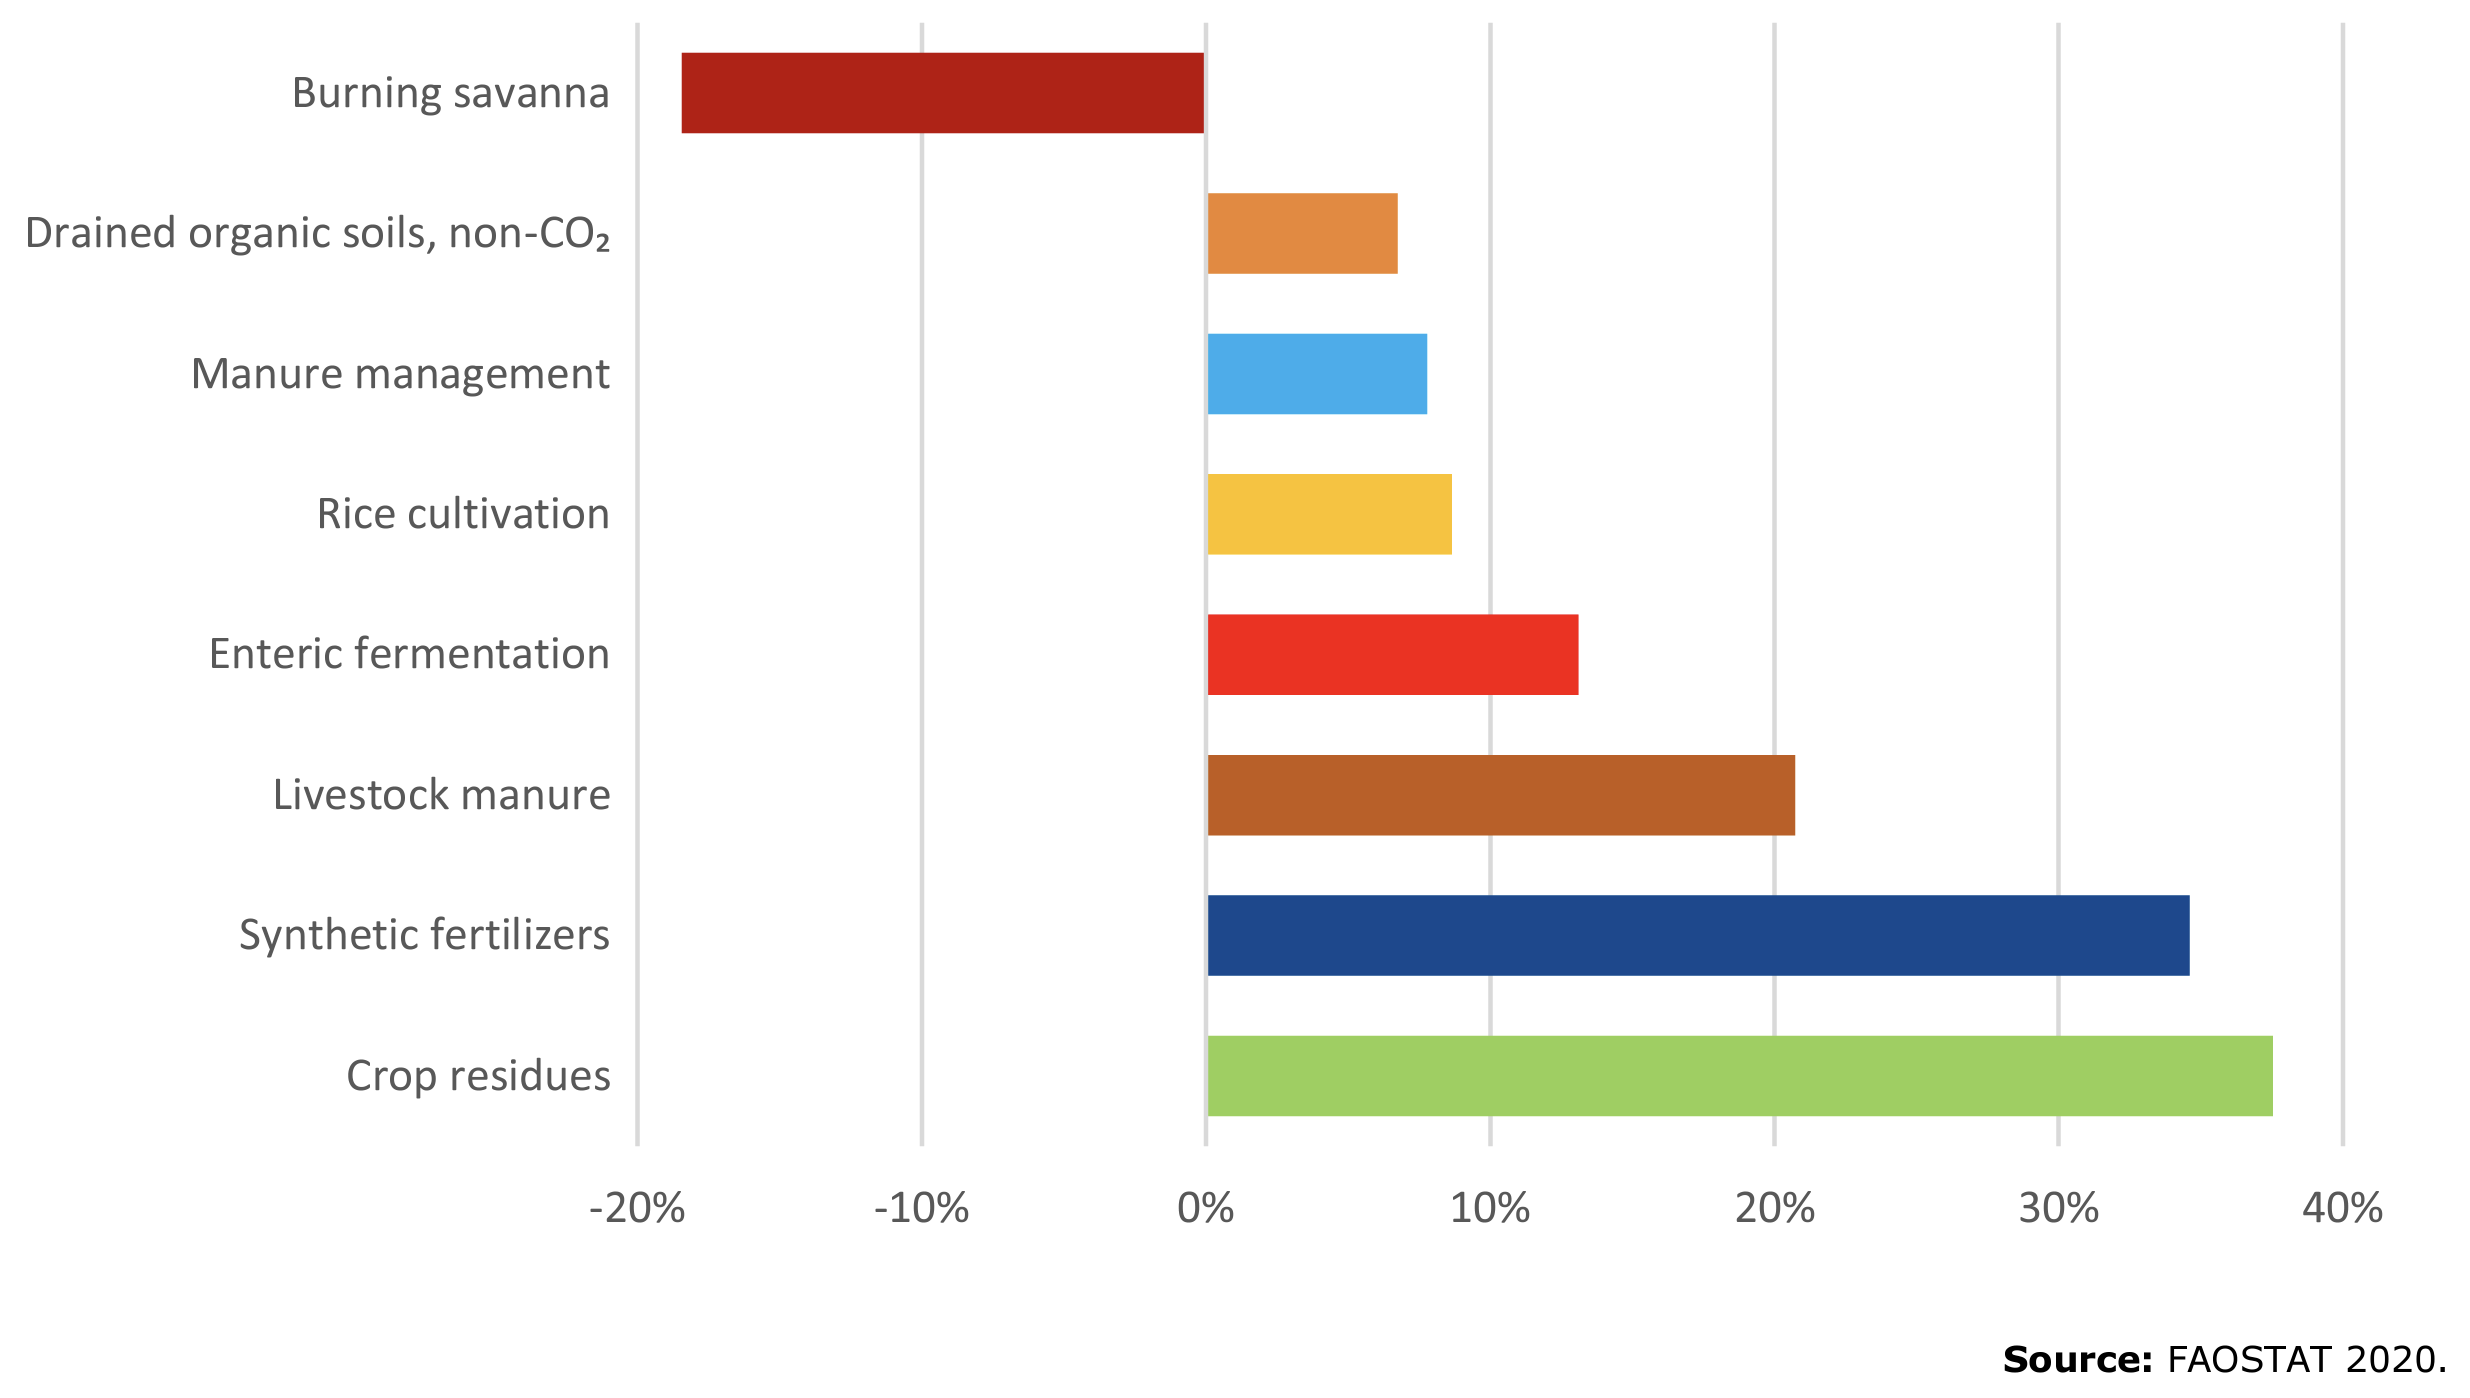
Source: FAO, 2020, p. 4
While absolute emissions from agriculture and related land use decreased by 4% since 2000, in part attributable to the aforementioned fall in deforestation, methane and nitrous oxide emissions from crops and livestock rose by 14% from 2000 to 2018 (FAO, 2021). Figure 4 provides a breakdown of the change in non-CO2 emissions from crop and livestock activities from 2000 to 2018. The 6th IPCC report notes that “globally, the AFOLU sector has so far contributed modestly to net mitigation, as past policies have delivered about 0.65 GtCO2 yr-1 of mitigation during 2010–2019 or 1.4% of global gross emissions (high confidence)” (Nabuurs et al., 2022, p. 751). The sector is an untapped source for mitigation policies. Only wind and solar energy supersede AFOLU in terms of potential abatement according to the IPCC report (2022), among all types of mitigation options. It must be noted that the mitigation potential is subject to several factors, including the reference technology and emissions and the rate of technological uptake (Figure SPM.7, Lee et al., 2022). Given the share of global GHG emissions contributed by the agricultural and other land use sectors, the (estimated) carbon mitigation potential of agricultural land[4], and the share of global land occupied by agriculture (36.5% of global land area, 46% of habitable land, in 2020 (FAO, 2021), the agricultural sector offers significant opportunities for carbon emissions reduction.)
8.4.2 The European Union
The agricultural sector contributes 11% of total GHG emissions in the EU, according to the European Environment Agency (EEA) (Graph 9).
Graph 9 Sectoral shares in EU-27 in 2021.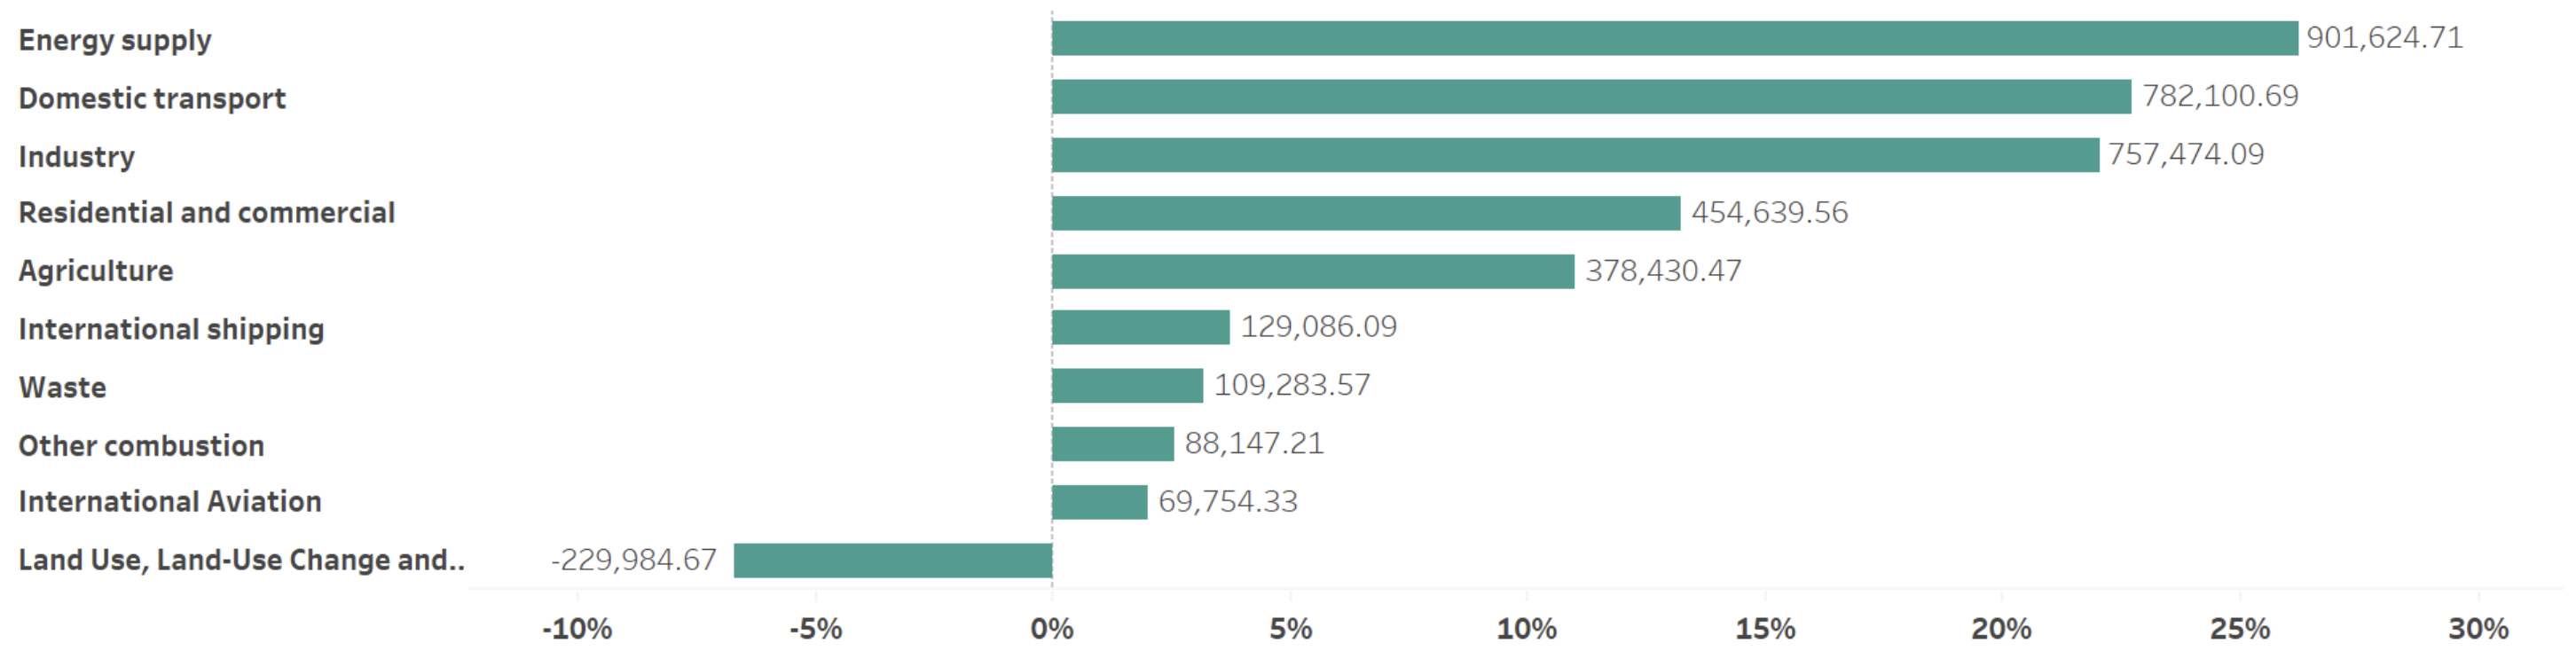
Source: European Environment Agency (2021)
The European Union (EU) exhibits similar trends in agricultural sector emissions to the global ones presented above. Non-CO2 GHG emissions from the agricultural sector in the EU have been relatively stable since 2005; the EEA notes a 2% reduction between 2005 and 2021. At the current rate, the EEA expects only a 2% decrease in non-CO2 emissions by 2030 compared to 2005, which could rise to 6% if currently planned additional measures were implemented (EEA, 2022), highlighting a need to develop further mitigation measures in the sector. The statistics are slightly better if CO2 emissions are considered: the FAO finds that Europe’s overall GHG emissions from the agricultural sector declined by 8% between 2000 and 2018 (FAO, 2020).
There are three main sources of pollution in the European agricultural sector: fertilisers, mechanical equipment, and enteric digestion. 58% of emissions in the sector originated in animal activities, of which the majority comes from digestion processes. This is followed by nitrate emissions from soil management such as fertilisers that amount to 38% of the sector’s emissions. Finally, less than 5% of CO2e emissions come from mechanical processes in agriculture (Graph 10, European Environmental Agency, 2022). The emissions are standardised in terms of CO2 equivalence, since the climate-forcing potential varies according to each gas.
Graph 10 Non-CO2 emissions from the agricultural sector in the EU.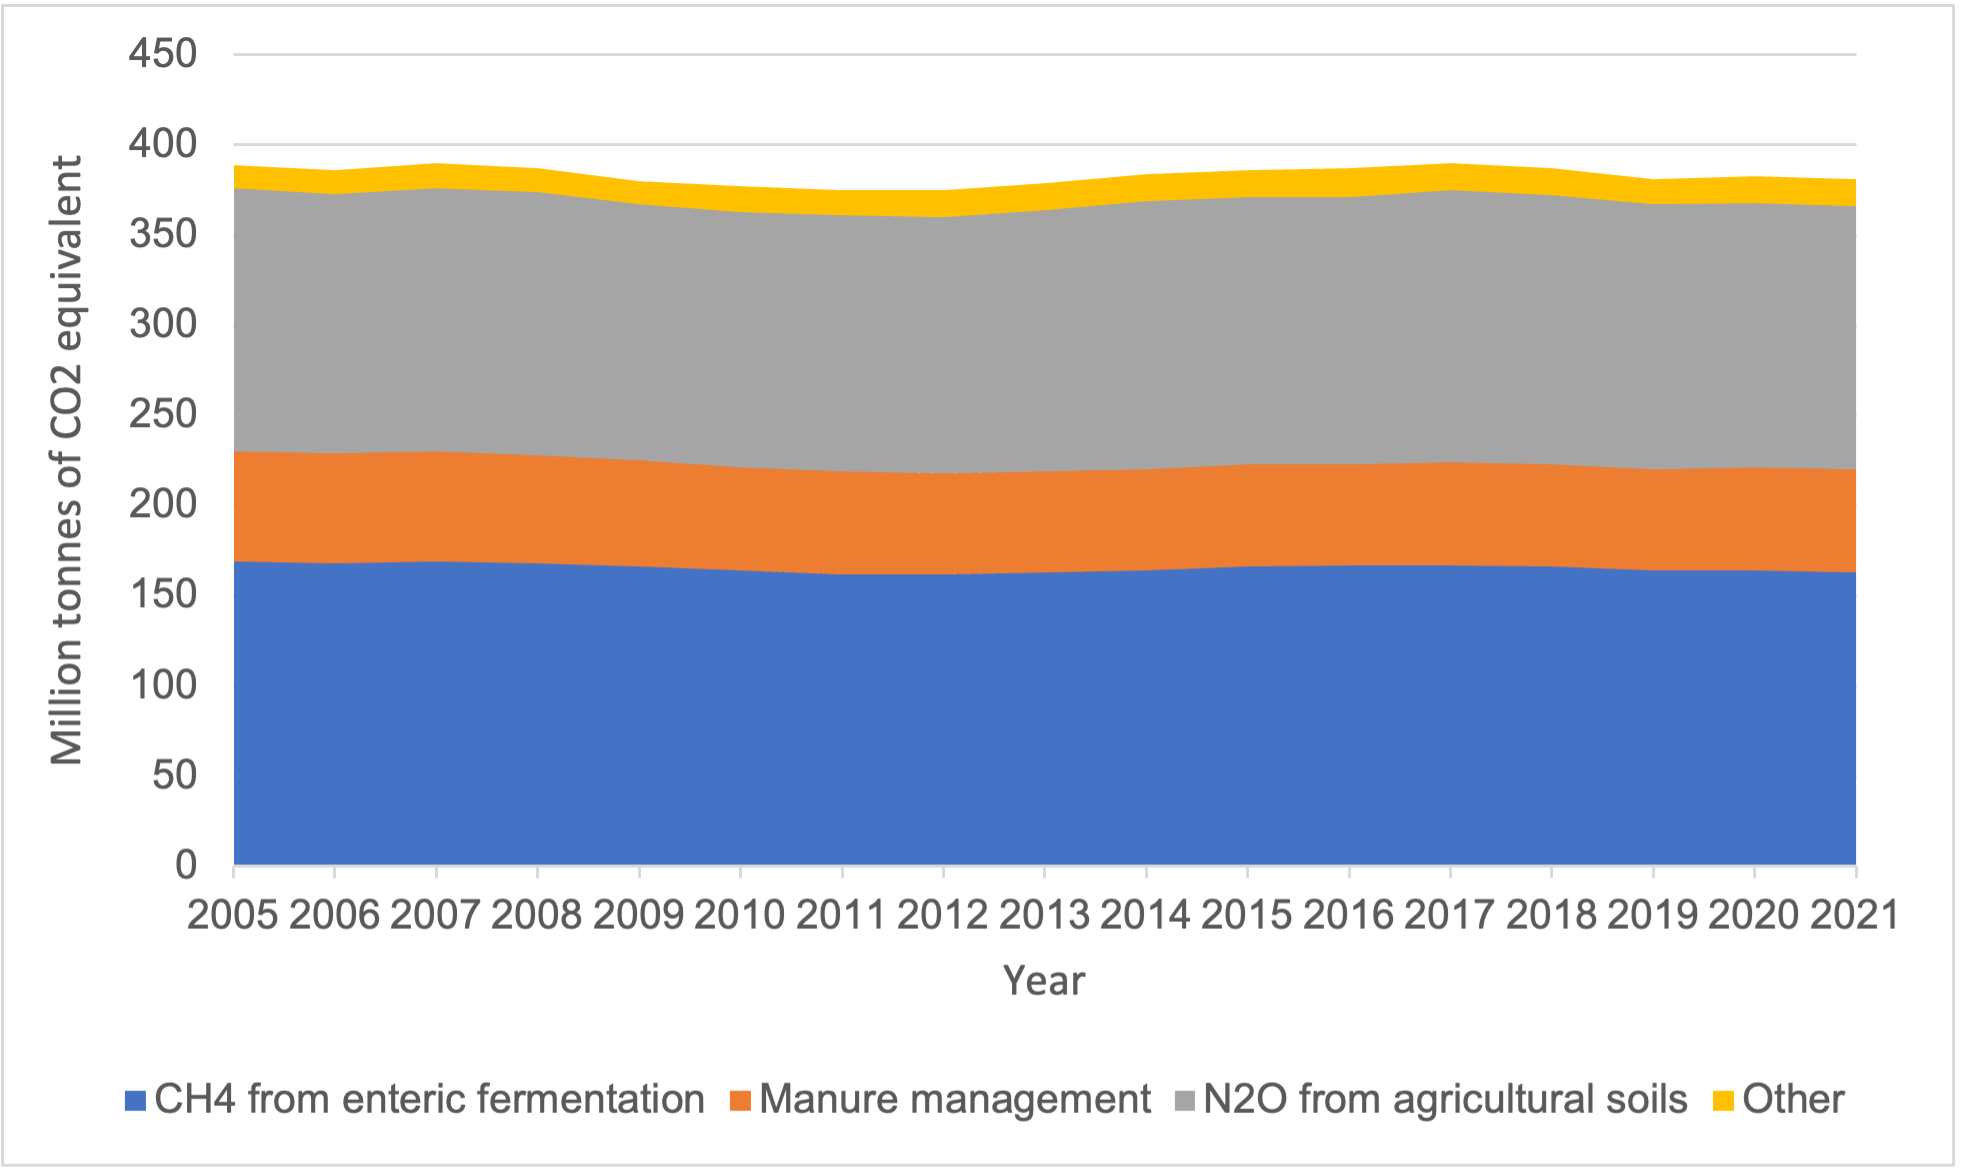
Source: Eurostat
In Europe 73% of agricultural emissions are due to crop and livestock production, slightly above North America and Asia, but lower than Oceania, while in Africa and South America emissions are dominated by land use and land use change processes (FAO, 2020). This ratio in European agricultural emissions indicates the need for agricultural practices more efficient in terms of emissions reductions.
8.4.2.1 European agriculture from a geo-demographic point of view
Figure 19 indicates that since 1990 cropland has held a significant responsibility for GHG emissions from the LULUCF sector (39.2% in 2020), followed (and only in 2016 slightly exceeded) by those from settlements (urban trees, parks, or other above-ground biomass in human settlements).
Figure 19 LULUCF sector emissions and removals in the EU, by main land use category.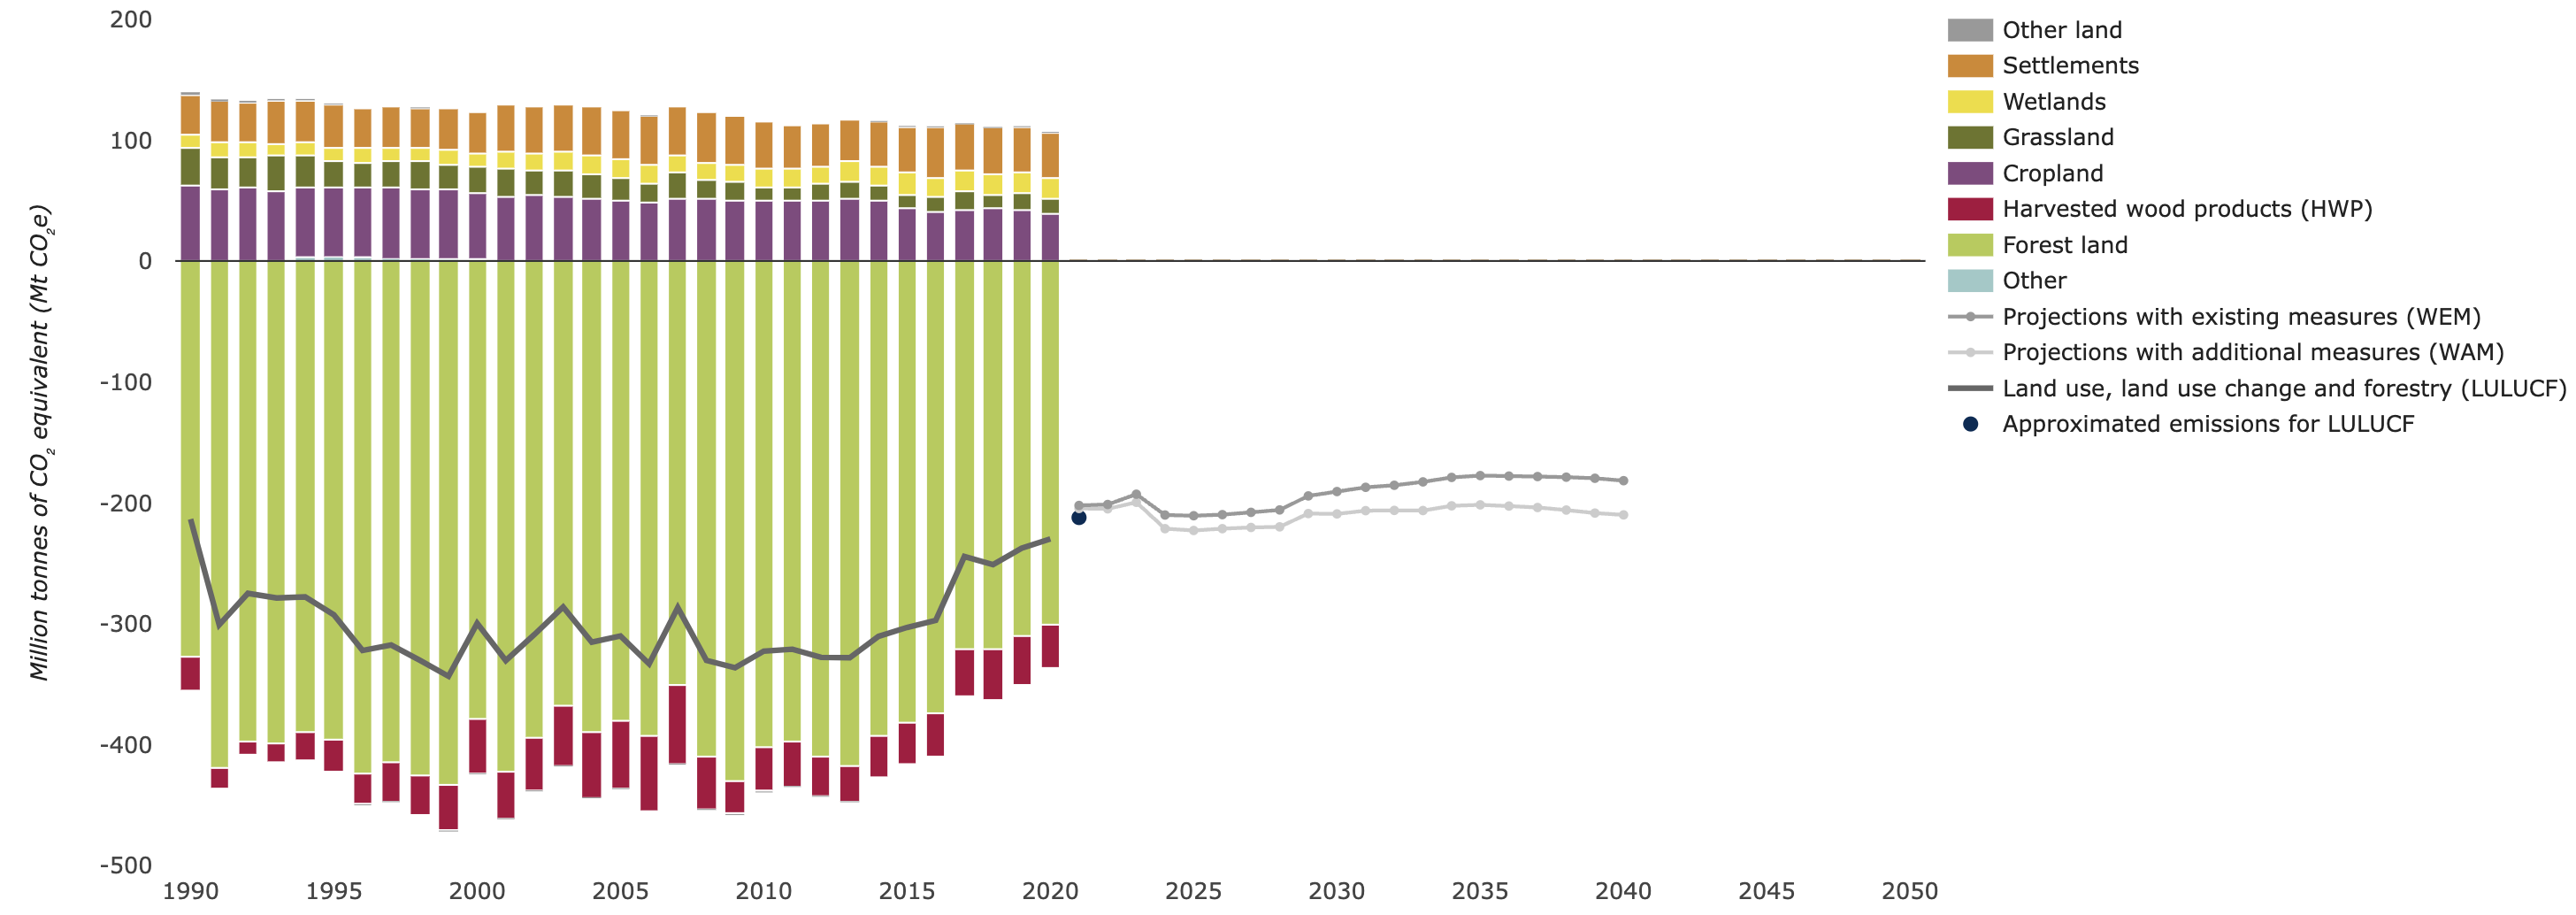
Source: European Environment Agency. Emissions data for each land use category are taken from the" National emissions reported to the UNFCCC and to the EU Greenhouse Gas Monitoring Mechanism" dataset.
Farms (at utilised agricultural area (UAA), excluding wooded areas (5.9%) and other farmland not used for agriculture (2.2%)) constituted 38% of the EU’s total land area in 2020 (Eurostat, 2022). The majority of these farms (63.8%) were small, at less than 5 hectares, in line with the finding that the vast majority (94.8%) of EU farms in 2020 were family farms, i.e., where family members provide at least half of the farm’s regular agricultural labour force. In terms of area coverage, land is dominated by a small number of larger farms: 68.2% of the EU’s utilised agricultural area (UAA) is covered by farms that are 50 hectares or more, but these constitute only 7.5% of the EU’s farms. However, the share of land held by large farms looks to be growing. While the total area of land used for farming has remained stable, the number of farms decreased steeply (37%) between 2005 and 2020, 87% of which were small farms (less than 5 hectares). This reduction is in part due to changes in some Member States’ definitions of the minimum land area to be counted as a farm. Nonetheless, the shift is resulting in a trend towards a smaller number of larger farms in the EU, with the number of largest farms in the EU increasing.
The EU therefore presents a context in which:
-
More than a third of its land is agricultural;
-
The majority of this land is owned by a small number of large farms;
-
The majority of farms are family-owned, and more than half are small
farms; -
Agriculture contributed 11.63% of the EU’s GHG emissions in 2020 and
its share since 2000 has remained relatively stable; -
Emissions from the LULUCF sector have gradually increased since 2005.
The European regulations that govern these emissions will be discussed in the following section to better understand the current state-of-art and the future directions.
8.5 European regulations
8.5.1 Effort Sharing Regulation
Agricultural emissions in the EU are regulated by the Effort Sharing Regulation (ESR) (European Council, 2023). The ESR sets targets for national institutions on emissions reductions in all sectors that are not covered by the EU’s Emissions Trading System (ETS)[5]. The European Union has established a system of equivalence between the ETS, the ESR, and the LULUCF regulation, which governs carbon removals in the land use, land use change, and forestry sector. Under the LULUCF regulation Member States have targets for carbon removals, which are then recognised in the form of land use credits (Böttcher et al., 2019).
All member states can use up to 262 million credits from the land use sector (131 million credits in each of the periods 2021-2025 and 2026-2030) to meet their national agricultural emissions targets. There is an even higher credit access for member states whose agricultural sector constitutes a large share of their emissions. The mechanism is based on the assumption of a lower emissions mitigation potential in the agricultural sector, and with the aim of stimulating greater action in the LULUCF sector (European Commission, n.d.-b). It effectively results in an ‘internal offset’ system, whereby Member States can meet their ESR compliance requirements by ‘offsetting’ their agricultural emissions through carbon removals in the land use sector. Likewise, in reverse, Member States can compensate for sub-target LULUCF carbon removals by ‘deleting’ or lowering their annual emissions allocations under the ESR (Böttcher et al., 2019). This integration has been strongly criticised by actors warning against the dilution of climate ambitions and the unreliability of carbon sequestration in the LULUCF sector, compared with carbon mitigation (Carbon Market Watch, 2016).
Furthermore, under the ESR, nine member states[6] are allowed to use a percentage of their ETS allowances, within limits[7], to offset emissions in effort-sharing sectors from 2021 to 2030. Eligible Member States are those that “have national reduction targets significantly above both the Union average and their cost-effective reduction potential, or which did not allocate any EU ETS allowances for free to industrial installations in 2013” (European Commission, n.d.-b).
8.5.2 European Carbon Removals Certification (CRC) framework
In November 2022 the European Commission adopted a proposal to develop a voluntary certification framework for carbon farming (European Commission, 2022), building on the Commission’s and Parliament’s research over the preceding years into carbon farming in the EU. The framework and its accompanying targets aim to expand the EU’s shrinking land sink by 20% by 2030 to -3120Mt CO2e (European Environment Bureau, 2022). Falconi (2023) notes that, on the one hand, this directive offers an important change of approach towards the agricultural sector, recognising its capacity to mitigate emissions, as opposed to exclusively being a high emitter. The proposal sets out QU.A.L.ITY standards for carbon farming that aims to be accurate and effective (European Commission, 2022), where the acronym stands for:
-
QUantifiability: Carbon farming outcomes should be quantifiable
-
Additionality: Outcomes should be in addition to outcomes that would already have occurred through existing practices
-
Long-term: Carbon removals should be permanent
-
SustainabilITY: Carbon farming activities should contribute to the wider sustainability of the area.
After providing the political landscape that guides the adoption and scaling up of carbon farming, in Section 8.7 we will delve deeper into the deriving practical implications, and we will discuss how voluntary carbon markets work by presenting the actors involved and how they act and interact.
8.6 Implementation of carbon farming projects and VCMs: governance and practices
The aim of CF is to incentivise farmers to implement carbon mitigating agricultural practices through private funding provided by those entities that want to offset or compensate for their emissions. Carbon farming practices are issued via projects of removal, avoidance, and reduction of emissions. To produce carbon offsets, a carbon farming project needs to be additional (i.e., producing results that would not have happened without it), permanent (long-term monitored efficiency), reliable (accuracy in mitigation calculation) and avoid carbon leakage (which would entail a failure to reduce, avoid or remove carbon) (European Commission et al., 2021; Scheid et al., 2023; Kim and Pierce, 2018). This means that there must be an action or a change in practices with quantifiable mitigation outcomes. Every action or change has a different mitigation potential (European Commission et al., 2021) and requires different assessment methodologies. In the following subsections, the types of CF projects and the relevant economic aspects of implementation will be discussed. Then, some case studies will be presented to analyse how carbon farming and voluntary carbon markets have been implemented in practice.
8.6.1 Types of carbon farming projects
There are two criteria to classify carbon farming projects: the emissions mitigation outcome they produce and the type of activity they concern. Regarding the first, there are three main alternative projects available to generate offsets in the agricultural sector: emissions avoidance, emissions reduction, and carbon removal. Avoidance projects aim to conserve forests, grasslands, wetlands, peatlands, and other natural storages of carbon from existing threats in their surrounding areas. The premise of success for such a project is that the local environment would degrade if the project (which avoids deforestation and/or degradation) were not implemented. Emissions reduction projects aim at changing the carbon footprint of local business models by adopting different technologies that reduce their greenhouse gas emissions, including renewable energies and rendering existing technologies more energy efficient.
Removal (or enhanced sequestration) projects actively aim at removing CO2 emissions from the atmospheric stock and can take different forms according to the nature of the instruments. For instance, they can be nature-based initiatives, which use the environment as a tool to capture emissions and store them stably for a long-term duration, such as afforestation, reforestation, forest restoration, blue carbon such as mangrove restoration, peatland restoration, soil carbon sequestration, and fire management. There are also technological solutions for absorbing CO2, including Direct Air Capture (DAC), or Bioenergy, Carbon Capture (Use) and Storage (BECCUS). These are anthropogenic measures and often intend to feed the captured emissions back into the economy in the form of input for production or material outputs.
Concerning the second criterion of classification, there is no official taxonomy of carbon farming activities. For example, the European Commission et al., (2021) identify the following as CF activities: peatland restoration and rewetting; agroforestry; maintaining and enhancing Soil Organic Carbon (SOC), livestock and manure management; managing SOC on grasslands. However, in New Zealand, afforestation and permanent forest management are also considered carbon farming. In this chapter, we include and refer to all activities belonging to the AFOLU sector.
8.6.2 Economic aspects of the implementation of a carbon farming project
There are several economic aspects to consider when deciding to set up and maintain carbon farming activities. In this section, the practical functioning of VCMs and CF projects will be discussed to identify the economic elements that must be taken into account to make a carbon farming activity effective and efficient in the long run.
8.6.2.1 The market: types of VCMs
Figure 20 shows how a voluntary carbon market works: it all starts from the standards used to monitor, report and verify (MRV) the project and the carbon credits created. Monitoring refers to the measure of a decrease in emissions or increase in sequestration. Reporting deals with the communication of these processes. Finally, verification is linked to the ability of third parties to verify and ensure the accuracy and truthfulness of these results. Accuracy and truthfulness can enable fair procedures and provide trust to end buyers and land owners, avoiding what we can define as “carbon grabbing,” namely, claiming carbon offsetting without guaranteeing adequate remuneration to farmers and/or just treatment of the land and its inhabitants.
MRV procedures follow two approaches, which are direct measurement and modelling. While the former is more accurate but also definitely expensive, the latter refers to estimations based on proxy data and scientific relationships and has significantly lower costs. The most commonly used standards are the Verified Carbon Standard (VCS) by Verra, the Gold Standard, the Clean Development Mechanism (CDM), the Climate Action Reserve and American Carbon Registry (Kim and Pierce, 2018). However, the quantity and geographical spread of standards create criticalities in the fungibility and traceability of carbon credits.
In general, a VCM uses the standards to organise the MRV of carbon credits that are issued by a CF project. Every project is started by project developers, which can be public, private entities, or a combination of these (European Commission et al., 2021). The project involves landowners or farmers who act to reduce, avoid or remove emissions from the atmosphere with the aforementioned CF activities. The farmers or landowners are paid for this emission reduction, which is sold to end buyers through financial institutions, start-ups, and private or public intermediaries, assuring that the project respects the standards. Once the carbon offset issued is claimed as an emission reduction, the credit is defined as retired.
Figure 20 A mapping of the mechanisms of voluntary carbon markets.
Authors’ adaptation of Shen and Singh (2022) and Favasuli and Sebastian
(2021)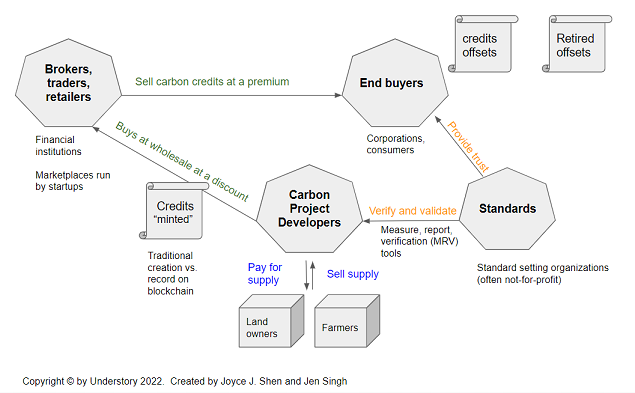
In the literature (European Commission et al., 2021; McDonald et al., 2021), two main distinctions are made in the classification of VCMs. In the first place, a VCM can be public, when promoted and developed by a public entity (like in the case of CarbonAgri by Label Bas Carbone, in France), or private, when it is promoted and developed by a company or a non-profit organisation (like in the case of Moorfutures, in Germany). The second distinction is between VCMs with an intermediary and exchange based VCMs. In this case, the difference is in the intervention of an intermediary, who helps in the project development, covering the initial costs and selling credits when they are issued. The intermediary may operate a registry to track credits but remains responsible for the integrity of the credits (the case of Peatland code schemes), which are usually not fungible and tradable with other markets. In exchange based VCMs, different project developers refer to a central registry and issuer to track credits, allowing fungibility and traceability among credits coming from different sectors of CF activities (like in the Green Deal scheme in the Netherlands). The credits produce payments for farmers participating in projects, the calculation of which is explained in the following paragraph.
8.6.2.2 Payments
The ultimate economic purpose of carbon farming is to generate remuneration for farmers, i.e., their payment. Since farmers’ payments depend on the environmental outcome, MRV of the level of emissions mitigation or removal (McDonald et al., 2021) has become a fundamental element of carbon farming projects. Payments can be of three types: action-based, results-based, or hybrid.
Action-based. Farmers receive payment for taking a specific action, for example, complying with a farming practice or implementing carbon farming technologies (nature-based or technology-based solutions, such as anaerobic digesters or nitrification inhibitors). They are relatively simple and have low monitoring requirements, both for farmers and administrators, but they have an uncertain impact on the actual mitigation deriving from the action.
Results-based. The payment depends on the quantification and verification of the mitigation outcome (i.e., the tonnes of CO2 emissions that are sequestered or not emitted), aside from the action taken. This kind of payment is more certain from an environmental point of view but is more expensive and complex.
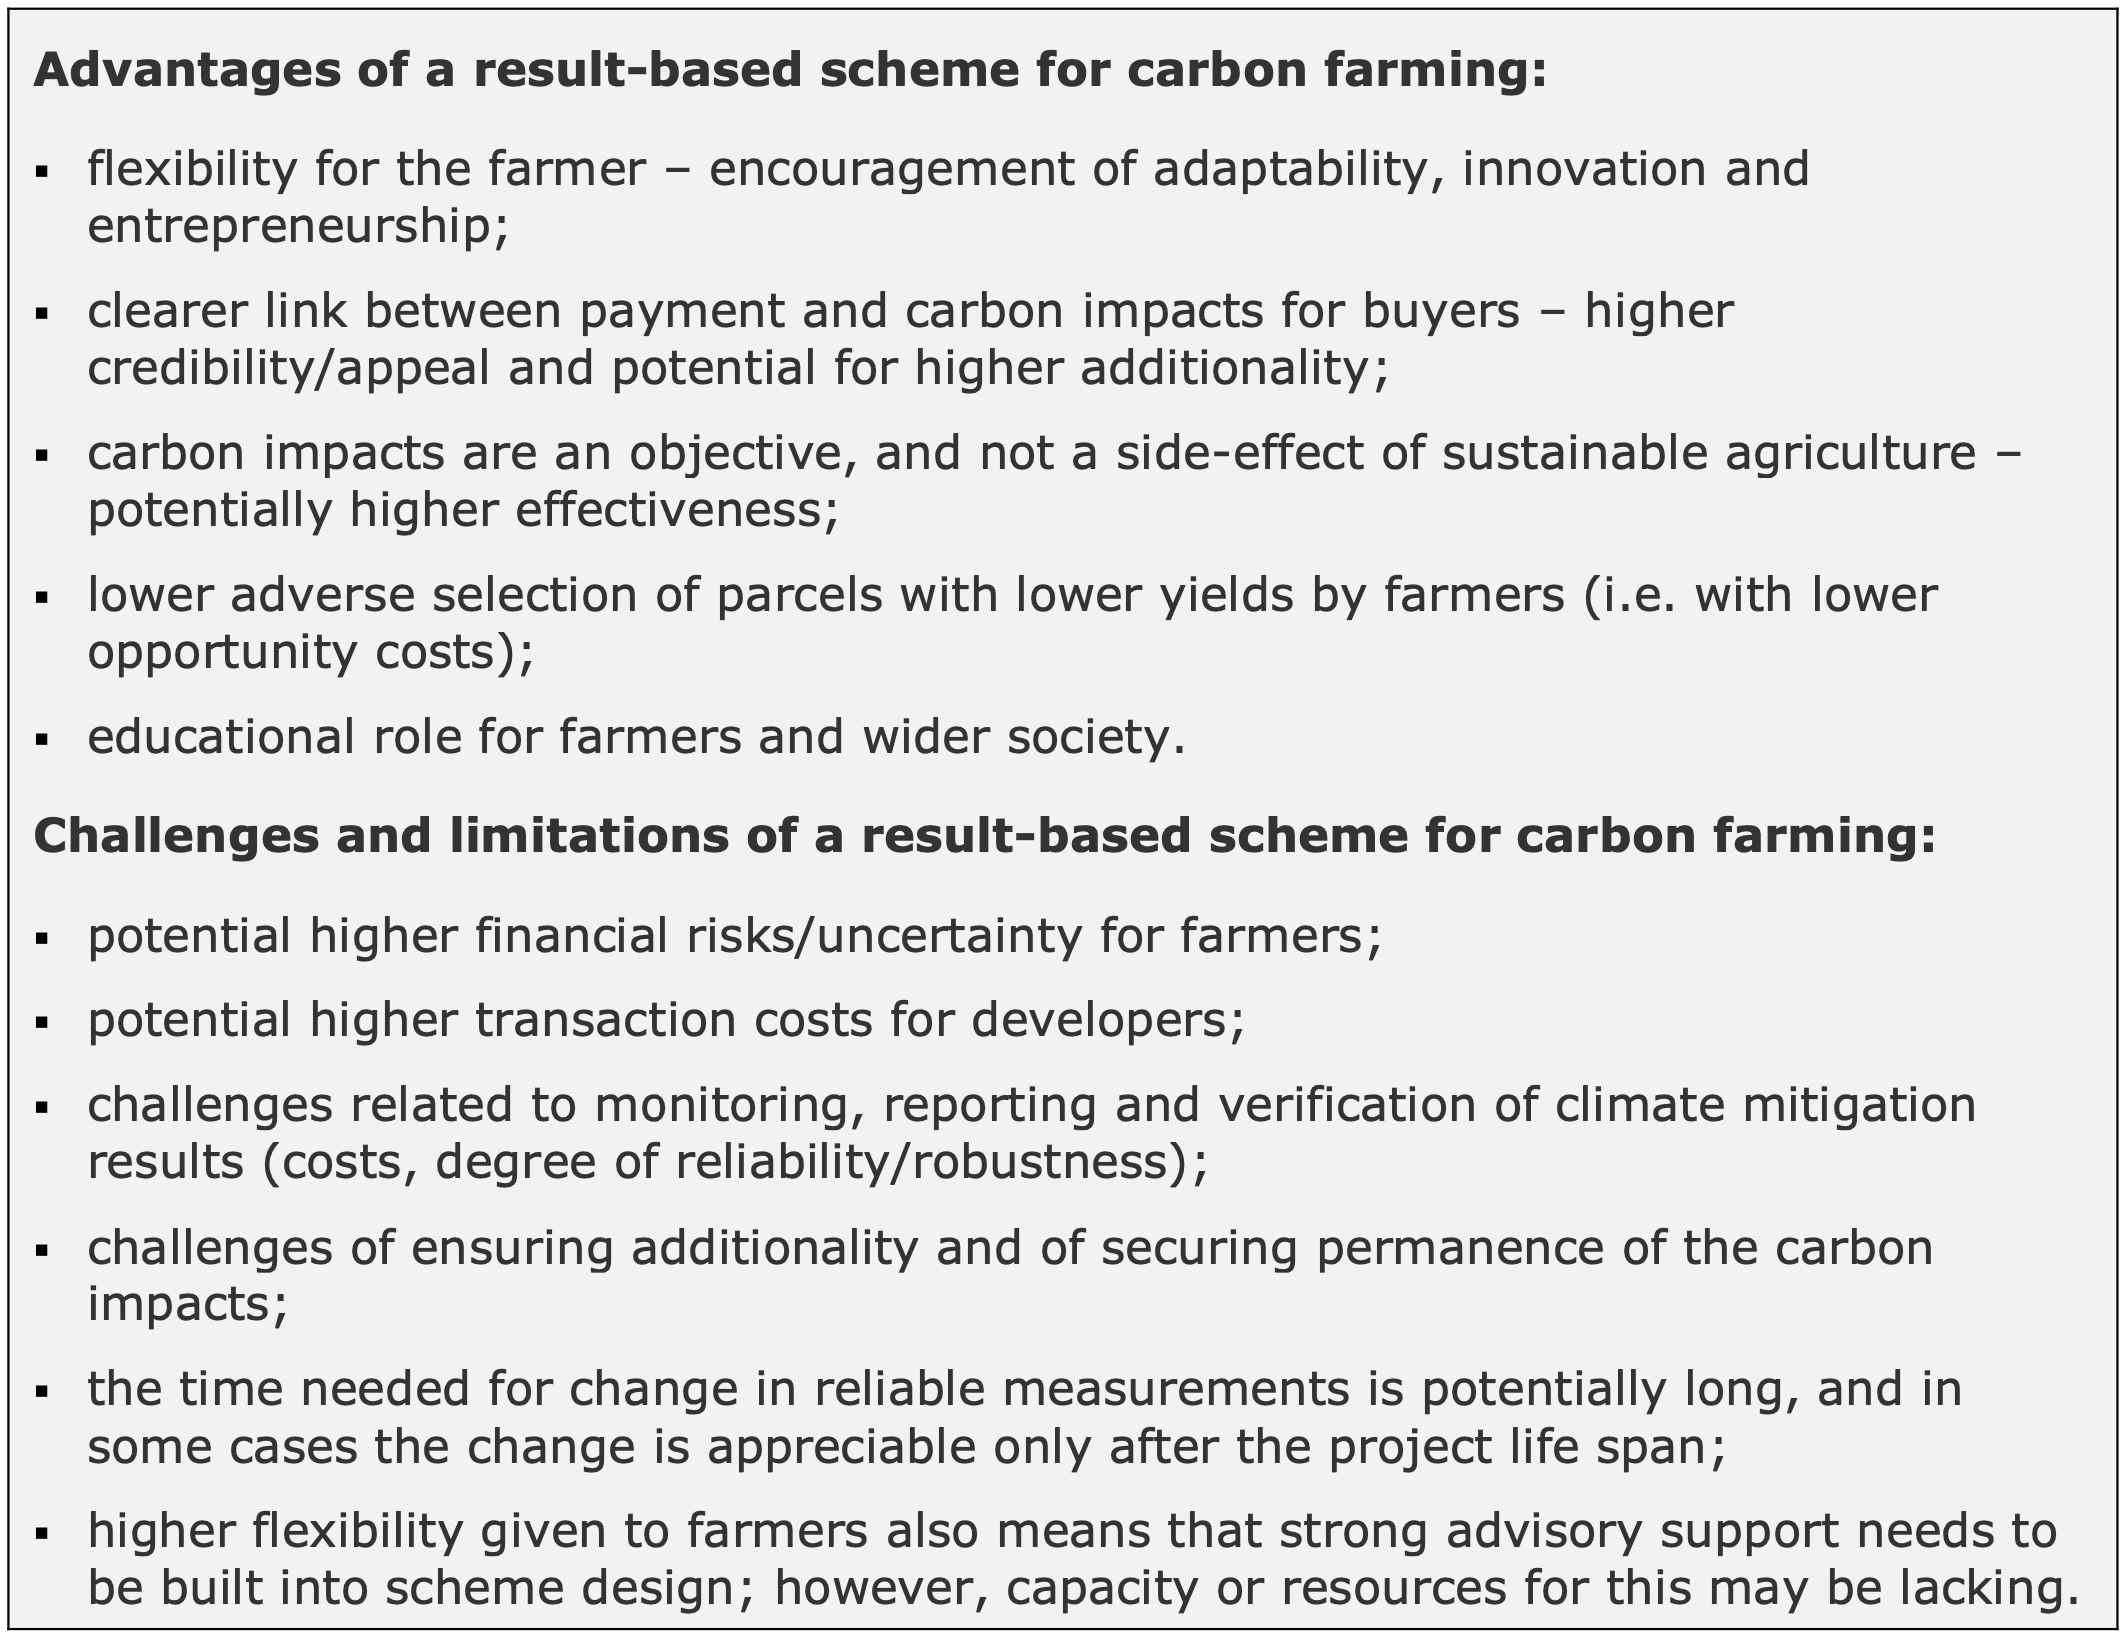
Hybrid. These payments consist of a) guaranteed, up-front (for implementation costs or financial risk reduction) or low-risk payment for farmers for implementing specific farm management actions; b) additional payments coming from the measurement of mitigation results (Falconi, 2023). This last model can lower risk and provide flexibility to farmers, providing real results against climate change. The box below summarises the advantages and disadvantages of results-based carbon farming mechanisms, which have been adopted in the EU’s proposed carbon removal certification mechanism (European Commission et al., 2021, p. 17):
8.6.2.3 Costs
Every project development involves costs. The literature analysed (McDonald et al., 2021; European Commission et al., 2021) shows that the uncertainty and costs of MRV, which are decisive when deciding to start a CF project, vary according to different CF sub-categories (managing peatlands, soil carbon on mineral soils, agroforestry, and livestock and manure management) (Table 14).
Table 14 Costs and uncertainty of sub-categories of carbon farming.
| Carbon farming sub-category | MRV | ||
| Type of monitoring | Uncertainty | Costs | |
| Managing peatlands | Modelling | Medium | Medium |
| Measurement | Low-medium | Very high | |
| Soil carbon on mineral soils | Modelling | High | Medium |
| Measurement | Medium | Very high | |
| Agroforestry | Combined | High | High |
| Livestock and manure management | Modelling | Medium | Low-medium |
Looking at Table 14, only measurement in peatland carries low-medium uncertainty. This is because open-air measurements are extremely difficult, and scientific research is still working on developing precise and scalable methods to allow the quantification of emissions reductions. High costs are also due to this limitation and constitute a significant obstacle to implementation.
The costs can be borne by administrators or by farmers and depend on the phase of the project (set-up or ongoing). These are summarised in the table below, taken from the work of McDonald et al. (2021).
Table 15 Set-up costs and ongoing costs for administrators and farmers in a voluntary carbon market.
| Actors | Set-up costs | Ongoing costs |
| Ad ministrators | Mechanism design Scientific research/data collection Baseline setting and validation Outreach and training |
Monitoring and verification Mechanism administration Funding* |
| Farmers | Learning costs Baseline setting* Implementation costs |
Implementation costs Opportunity costs Transaction costs* |
Source: McDonald et al. (2021)
Set-up costs are usually fixed costs. For this reason, they will generally be lower in larger mechanisms or when considering existing data and research, and higher in more complex mechanisms that involve new on-site measurements. As can be seen in Table 15, these costs concern:
-
Mechanism design, which refers to the development of the methodology and all operating and governance regulations (this will be expanded upon in the following section);
-
Scientific research and data collection, which consists of methodologies for appropriate calculations of local mitigation;
-
Baseline setting and validation, which is the cost of setting farmers’ baselines such as sampling or consultant visits (that can be borne by farmers or administrators) or the validation of new participants or projects (borne only by administrators);
-
Outreach and training, which from the administrators’ point of view, are the costs of attracting farmers, and from the farmers’ point of view, are the costs of learning new skills and knowledge;
-
Implementation costs that farmers bear to implement carbon farming actions, such as buying technologies and equipment, planting trees, or rewetting.
Ongoing costs are variable: they can increase when the number of farmers participating in a project is higher, unless economies of scale are implemented, or when there is high complexity, which leads to higher administrative costs. Moreover, transaction costs for farmers also depend on MRV requirement levels: they may be expensive and thus unbearable for small farms.
This is a particular issue where mechanisms require on-site visits and sampling to measure baselines and changes in, e.g., soil carbon stocks. This varies considerably according to the carbon farming mechanism model: Label bas Carbone CarbonAgri estimates that the cost of consultant site visits is €2000 per farm every five years; GoldStandard projects face between USD 67,500 and 87,500 of verification, validation, and registry costs in the first five years (European Commission et al., 2021); and the LIFE CarbonFarmingScheme (McDonald et al., 2021) estimates project validation, verification, and market registration costs of €110,000-240,000 within the first five years. In addition to reducing net benefits, these high MRV costs can mean that only large farms or farmers can participate in high-MRV mechanisms.
8.6.2.4 Case studies
The lack of regulation and the wide range of CF activities give project developers the opportunity to structure VCMs with different combinations of elements. For example, some projects may use MRV standards promoted by registries (like VCS by Verra); others may develop and use their own methods and models; some may act locally; and others may be international, resulting in different prices and mechanisms. For these reasons, transparency and comparability among projects are hindered and lead to three main issues: i) both sellers and buyers may encounter obstacles in selecting the projects to participate in (an obstacle resolved by the intermediary); ii) the scalability of VCMs is complicated; iii) there is high uncertainty over actual emissions reduction.
When project developers or intermediaries use the same standards, these issues are more under control. This is witnessed, for example, by the Berkeley Carbon Trading Project, a research project aimed at assessing the effectiveness of carbon offset projects to support programme design. The project’s outcome is a dataset containing all the carbon offset projects, credit retirements and credit issuances belonging to four major registries, which are Verra (VCS), Gold Standard, American Carbon Registry (ACR) and Climate Action Reserve (CAR) (So et al., 2023). Every registry uses their own certified methodology, increasing standardisation among projects within a registry and, consequently, comparability and transparency. However, when a project does not refer to one of those registries, the aforementioned issues (obstacles in selecting project, hindered scalability and high uncertainty) persist. Moreover, even though the four registries generate almost all the world’s voluntary market offsets, the map provided by Berkeley’s project shows that there is a high concentration of projects in India, U.S. and China. Our desk research, mostly focused on Europe, shows instead that the growing interest in political agendas towards CF and VCM is increasing the number of local VCMs developing their own methodologies and mechanisms.
In order to test comparability among projects that do not necessarily follow registries’ standards, we reviewed seven VCMs (summarised in Table 16) that were not included in Berkeley’s list. We took information coming both from desk research (project’s websites and informational material) and from the literature (McDonald et al., 2021; European Commission et al., 2021; Scheid et al., 2023). As expected, all projects use different methodologies and comparability is limited.
Table 16 Case studies, elaboration of the authors
| Project Name | Scope | VCM Type | Reduction/ removal | Methodology | Country | Management (trademarked by) | Total credits issued (tCO2-e) | Price (per tCO2-e) | Sources |
| Moorfutures | Peatland rewetting | Intermediary - Public | Reduction and removal | VCS Kyoto Protocol | Germany | State of MecklenburgWestern Pomerania” | 69,000 (by 2060) | €40-80 | McDonald et al. (2021) |
| UK Peatland Code | Peatland rewetting | Intermediary - Public | Reduction | Independent validation for each project. | UK | Executive board on behalf of IUCN UK National Committee | 6,268,139 | £15-25 | Scheid et al. (2023) |
| CarbonAgri (Label Bas Carbone) | Livestock and manure management | Intermediary - Public | Reduction and removal | LCA & CarbonAgri CAP’2ER® | France | Ministère de la Transition Écologique | 137,000 | €40 | https://www.france-carbon-agri.fr/page-1/ |
| Acorn | Agroforestry | Intermediary - Private | Removal | PlanVivo | The Netherlands | Rabobank | 236,091 | €31 | https://acorn.rabobank.com/en/ |
| Life Carbomark | Afforestation | Intermediary - Public | Removal | IPCC VCS | Italy | Veneto Region, Department for Forest and Mountain Economy | 350 | €35 | https://www.lifegoprofor-gp.eu/best-practice/104/ita |
| Permanent ForestNZ | Afforestation (permanent forests) | Intermediary - Public (the VCM is public, NZ ETS) | Removal | Permanent Forest Sink Initiative (PFSI) | New Zealand | Consultancy company | 3,000,000 | $80 | https://www.permanentforests.com/ |
| New Zealand Carbon Farming | Afforestation (permanent forests) | Intermediary - Public (the VCM is public, NZ ETS) | Removal | Permanent Forest Sink Initiative (PFSI) | New Zealand | Consultancy company | 27,256,670 | $80 | https://nzcarbonfarming.co.nz/ |
8.7 Policy and governance challenges
The policy and governance challenges of voluntary carbon markets extend from the transnational level to the project level, and arguably even more so in the agricultural sector. Internationally, policymakers have yet to determine if and how to connect binding emissions reductions and accounting with offsets on the voluntary carbon market. Within the market, there are significant market imbalances, with actors’ mitigation ambitions exceeding the supply of projects to enable these mitigations, the supply of projects/credits exceeding real demand for them due to the lack of obligations to use them, and the issuance/demand for credits exceeding their eventual accounting or ‘retirement’. These imbalances are exacerbated by the sheer fragmentation of the market across several scales, registries, and certifications, leading to opacity in prices and efficacy. Carbon farming can offer co-benefits for ecosystems and societies but can equally have severe socioeconomic and environmental negative externalities, even more so in agriculture, given its role as the foundation of natural and human systems. Inadequate knowledge and transparency, preparation, safeguarding, and local rootedness have resulted in projects that either have limited positive impact or even do harm, adversely affecting the integrity and impact of VCMs. This section details these challenges before proceeding to discuss potential policy responses. It provides a specific focus on the challenges of the EU’s Carbon Removal Certification (CRC).
8.7.1 International governance
As explained in Section 8.3, the transnational policy arena currently faces the challenge of how to navigate the interaction (or lack thereof) between voluntary credits and nationally determined contributions (NDCs) under the UNFCCC.
Kreibich and Hermwille (2021) outline three international policy alternatives that emerge:
-
Not aligning voluntary credits with NDCs: leaving the current blurred lines between what does and doesn’t constitute NDC progress and not enabling the voluntary market to build on emissions reduction ambitions.
-
Corresponding adjustments: this is likely to lower the demand for voluntary credits but raise their long-term quality, integrity, and benefit for states’ decarbonisation
-
An additional certification or label for NDC-contributing projects: this is infrastructurally difficult as it entails creating a new product, but it could offer reputational benefits for companies, and address the market sector that is sceptical of carbon offsets’ environmental integrity.
At the national level, if CAs are to be pursued, states need bilateral agreements and strong public policy positions that render them obligatory, both by host countries and credit issuers.
8.7.2 International market actors and imbalances
There are three structural imbalances. First, actors often promise levels of emissions reduction and offsets that exceed the availability of projects to meet these goals (Miltenberger et al., 2021; Kreibich and Hermwille, 2021), leading to a perception of progress that exceeds capacity. Discussions at the COP27 conference paid particular attention to the need for greater accountability and transparency in non-state actors’ targets and claims (World Bank, 2023). The second imbalance concerns actual demand and supply. Despite the growing demand for carbon credits, supply continues to exceed demand, as actors are not universally obliged to meet certain reduction targets.
Lastly, the third imbalance is a result of carbon credit retirement being far below their issuances. Data on VCMs that focuses only on issuances therefore paints an unrealistic picture of the real amount of carbon mitigation (So et al., 2023). After a carbon credit has been traded, it must eventually be retired, i.e., removed from the market and accounted for in the buyer’s targets or obligations. A credit can only be retired once the carbon removal, avoidance, or mitigation has taken place. Credits issued from projects that have already been completed can be retired immediately. Credits issued from projects that are currently underway cannot be retired until the carbon farming outcomes have been achieved. The rate of retirement of carbon credits is therefore far below the rate of their issuance (see Graph 6 above and Figure 21). For example, just over half of the issued offsets are retired in the case of Verra and just under half for GoldStandard (Roman-Cuesta and Borghesi, 2022). The key issue emerges in terms of how these are labelled and reported. In the absence of specific labelling and accounting mechanisms, some actors make sustainability claims that have not in reality been fulfilled or, returning to the first imbalance, that cannot be fulfilled. As long as this prevails, the integrity and validity of the mitigations, both in terms of amount and quality, remain uncertain.
Figure 21 Voluntary carbon credit issuances on versus retirements as of 4 May 2023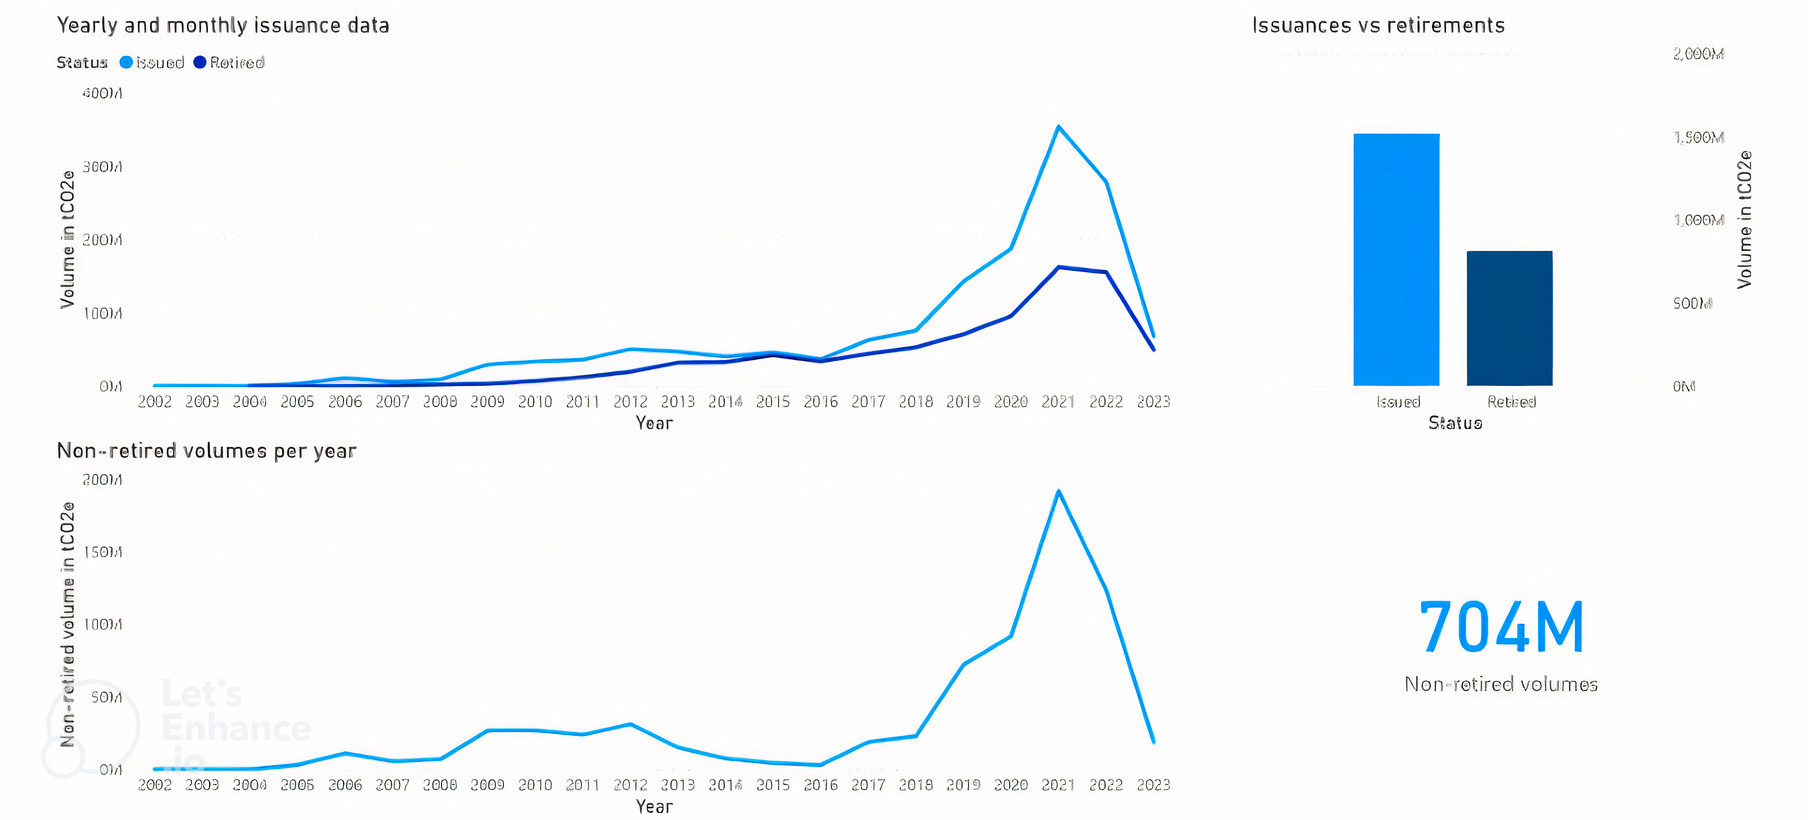
Source: Bravo and Mikolajczyk (2023)
There is thus a triangulation of ambitions that exceed the supply of projects and credits, a supply of credits that exceeds the demand for them, and a demand for credits that exceeds their rate of retirement. A further layer of complexity is that, although the infrastructure is not in place to match the current stated commitments, the level of commitments themselves fall short of the Paris targets (Kreibich and Hermwille, 2021; World Bank 2023). These challenges apply both within the voluntary and compliance sectors, as well as at their intersection (Michaelowa et al., 2019).
8.7.3 Heterogeneity and fragmentation
Carbon emissions reduction or offset projects can be expensive due to the costs of the technology and materials required and the MRV or intermediary services needed to obtain certifications, maintain environmental integrity, or operate on the market. This creates the first layer of fragmentation, i.e., the at times prohibitive costs of participating in a VCM. The constant evolution of the sector and the appearance of new taxonomies and definitions threaten the possibility of developing a high-quality market infrastructure capable of attracting investments and new actors, especially at the local level. This has been a recurring issue in carbon markets, starting from the early days of the CDM, which was flooded with new offset projects. Unstable climate policies can seriously affect the climate and market efficiency of VCMs and damage both local communities and the environmental performances of companies. Standardisation and unifying certification can play an important role in stabilising the market, granting more transparency, and guaranteeing a sustainable business model (World Bank, 2023) for the agricultural sector. The EU’s CRC is a step in this direction but is currently very much at a nascent stage, with the first expert group meeting only taking place in the first quarter of 2023.
Project heterogeneity in terms of technology, geography, methodology, rigour, and type, creates a lack of market transparency that renders it difficult to determine what the ‘true’ or ‘fair’ market price is (Chen et al., 2021). Without clear and consistent verifications of the integrity of a project, credits can be sold without any guarantee of a carbon reduction impact. Markets include projects implemented in the past that had less stringent, or absent, evaluations of their methodologies and impacts, and transactions in which a project developer risked being underpaid due to incomplete information on the current fair market value of carbon removals (Spilker and Nugent, 2022). As discussed above, intermediary platforms for carbon credits can create greater standardisation and reliability between their projects. At the same time, a proliferation of separate platforms or registries (as we are seeing now (World Bank, 2023)) can create fragmentation in its own right.
Furthermore, fragmentation between market structures, regulations, and jurisdictions is a key driver of double counting. Double counting can take two main forms. The first involves the carbon mitigation being simultaneously counted towards the mitigation requirements (compliance) of two actors. This leads to greater net emissions, as both actors claim mitigations and act accordingly. The second form is when the mitigation is counted towards compliance for one actor, and towards carbon neutrality by another actor. This need not necessarily result in greater emissions but can do so indirectly by causing a relaxation in carbon mitigation ambitions (based on assumed progress on compliance) and an increase in demand for high-carbon products (based on assumed neutrality) (Kreibich and Hermwille, 2021).
8.7.4 Measurement and quality
It is not yet clear how to quantify removals in a way that is affordable, accurate, and locally relevant, given the high costs of direct measurement and the geographical variability of models; what constitutes, and how to ensure, sufficiently long-term removals; and how to measure co-benefits such as those for society or biodiversity. Measurement and modelling to determine carbon mitigation outcomes can be costly and, moreover, suffer from the initial challenge of determining the baseline from which to measure additionality and permanence (Michaelowa et al., 2019; Chen et al., 2021; World Bank, 2023). LULUCF sector projects are particularly susceptible to miscalculating baselines and or ‘overcrediting’ (World Bank, 2023). Static baselines estimate the discrete GHG stocks of a project, while dynamic baselines consider the impacts of extreme weather, climate, and other natural risks and fluctuations. Carbon can be re-released due to human-induced reversals such as changes in ownership, policy, or market dynamics (European Environmental Bureau, 2021, Miltenberger et al., 2021). The fundamental challenges of determining baselines and additionality in line with local environmental practices, understanding real carbon removals, and taking into account fluctuating social and political situations that alter what is a ‘given’ and what is ‘avoided’ are central to enabling credits that genuinely contribute to carbon mitigation. The European Environmental Bureau (EEB) (2021), which was involved in extensive research into the prerequisites for effective carbon farming through soil management, finds the CRC severely lacking in terms of clarity on the permanence of carbon storage and related liabilities and on how to accurately monitor and report carbon farming activities. Furthermore, the EEB highlights and critiques the inclusion of emissions reductions as part of carbon removal certifications instead of distinguishing between reductions and removals.
8.7.5 Integrity and impact
From a climate perspective, most VCM initiatives and organisations providing support (e.g., the Task Force on Scaling Voluntary Carbon Markets (the TFSVCM), the Science-based Targets Initiative, and the Oxford Principles for Net Zero Aligned Carbon Offsetting consider offsets as an auxiliary measure to assist companies in building a carbon-neutral economy. Furthermore, emissions abatement and decarbonisation should be the primary concern for polluting companies, while offsets should reduce the hard-to-abate forms of emissions. Market actors – including project proponents, programme administrators and buyers – generally recognise that carbon credits are only helpful in achieving net zero targets if they have environmental integrity and, more specifically, if they distinguish between mitigation action that leads to emission reductions from compensatory carbon removals that address unabated emissions. Otherwise, they do not function to reduce corporate emissions, but instead result in greenwashing (Yu, 2020), where companies prefer to pay for their emissions rather than acting on abating them but make claims of carbon mitigation or neutrality (World Bank, 2023).
It can be cheaper and far less disruptive to buy external offsets, but it defeats the mitigation goals and breaks the trust in corporations and organisations, bringing with it reputational damages. As a result, many companies prefer to buy high-quality carbon removal credits – credits representing carbon dioxide that is removed from the atmosphere and stored either in the biosphere (e.g., in forests, soil or the oceans) or in geological formations, rather than credits representing avoided emissions. Achieving these high-quality returns to the aforementioned challenge of accurately measuring actions while keeping the mechanism accessible and affordable. In 2022 a journalistic investigation (Greenfield, 2023) shed light on the invalidity of the majority of Verra’s rainforest offset credits, which dominate the global market for forestry offsets. Whether due to malevolence, structural opacities, or insufficient grounding in local and scientific knowledge and practices, these at best cast doubt on the credibility of VCMs, and at worst cause real environmental and social damage. Lee et al. (2018) found that, unlike in the compliance market, stringent regulations or standards do not guarantee strong credit transaction performance on a voluntary registry, which raises concerns about how to simultaneously ensure high standards and increase demand. The EEB criticises the implied link between the proposed CRC and the inclusion of offset credits sold on voluntary carbon markets, highlighting the risk of actors not truly reducing their emissions, despite claiming to do so. The resulting risk of ‘greenwashing’ has been brought to the forefront of policy dialogue with the 2023 proposal for a European ‘Green Claims’ directive, which obliges actors to explicitly distinguish between their own GHG mitigations and those from offsets, and between emissions reductions versus carbon removals, with more stringent and clear methodologies for all mitigation methods (European Commission, 2023).
8.7.6 Social externalities and co-benefits
The development of VCMs has profound local implications. While VCMs risk having the aforementioned negative outcomes, they can also bring co-benefits in terms of positive social and environmental externalities such as job creation, conservation and biodiversity protection, and achieving local community goals such as preserving and sustainably managing their forests. Co-benefits consider the non-market values of VCMs. Lee et al. (2018) found that the presence of co-benefits makes voluntary carbon credit transactions more appealing, suggesting that their integration will be a lasting integral element of the VCM. This tendency is in part corrective, responding to discoveries that many carbon offset or removal projects compelled indigenous or local people to leave their land, or destroyed local biodiversity, resulting in both social and environmental harm. Streck (2021) argues that the risks of the VCM can be managed if the VCM complements government regulatory action. Furthermore, the author specifically highlights the essential role of local communities, especially given the current distribution of VCMs largely consisting of western organisations funding projects in economically poorer countries. This dynamic leads at times to a neo-colonial appropriation of materials and labour (Beymer-Farris and Bassett, 2012) for the purposes of one’s own carbon declarations, the aforementioned ‘carbon grabbing’. On the derivatives market, the CME Group’s futures trading in carbon credits currently requires projects to possess specific additional co-benefit labels, such as Verra’s CCB label (Spilker and Nugent, 2022). Streck (2021) emphasises the potential for public-private partnerships to develop the accuracy and legitimacy of registries’ metrics and labels for co-benefits.
Falconi (2023) calls for greater clarity and alignment across directives on the use of farmland for renewable energy and farmland for carbon farming, to avoid competing claims on farmers’ resources. The EEB (2022) critiques the lack of alignment between the CRC and related European targets and policies, namely the Nature Restoration Law, the Biodiversity and Forestry Strategies and the Land Use, Land Use Change and Forestry (LULUCF) Regulation, and the absence of provisions to prevent land grabbing or negative social externalities, which must be integrated to enable a sustainable and socially and environmentally just policy structure.
In conclusion, the emerging European policy landscape appears to be:
-
Driving carbon farming and removal practices;
-
Reshaping the role of agricultural actors, through carbon farming and other environmental practices like renewable energy and biodiversity conservation;
-
Creating a network of regulations that target interconnected issues (biodiversity, social justice, and carbon mitigation), but without these necessarily being formally connected or harmonised;
A formal recognition, but not an encouragement, of offsets, namely their inclusion in the CRC, with the requirement for them to be used far more stringently and declared transparently, given their uncertainty and risks.
8.8 Policy responses
A crucial element of knowledge fragmentation is the range of potential policy responses to tackle governance challenges, from the project level to the transnational level (Table 17). This section integrates proposed policies and responses to core challenges in VCMs from the policy papers and guides, most of which were developed in preparation for the EU’s carbon farming directive.
Table 17 Potential responses to policy challenges in governing voluntary
carbon markets; authors’ elaboration
| Challenge | Policy responses |
| Ambitions exceeding capacity | Mandatory science-based targets for ambitions, declarations, and offset usage (Kreibich and Hermwille, 2021; Miltenberger et al., 2021) |
| Greenwashing | Prohibiting the use of carbon removal certificates in place of emissions reductions; public disclosure of GHG emissions; linking credits to mitigation evidence; a social licence for firms to operate (EEB, 2022; Miltenberger et al., 2021). |
| Price uncertainties | Price guarantees by organisers; alignment with EU carbon pricing mechanisms and adjustment to national costs of living (European Commission et al., 2021; EEB, 2022). |
| Compliance credits | Prohibiting the inclusion of offsets/removal credits from the LULUCF sector in the compliance market; increases in compliance LULUCF targets to account for offsets bought by actors on the VCM; explicit links between domestic standards and national and local climate targets; mechanisms that enable interoperability of VCMs and compliance systems to mitigate the risk of VCMs oversupplying the market (EEB 2021; 2022; Cevallos et al., 2019; Miltenberger et al., 2021). |
| Uptake | Involvement of farmers in the creation of VCMs; ongoing knowledge and practical implementation exchange and support; environmental technologies for monitoring and decision making; explicit, binding emissions reductions targets for the agricultural sector; financial and administrative benefits for smaller farmers; not rendering carbon farming mandatory; ex-ante credits (European Commission et al., 2021; EEB, 2021; Demeyer et al., 2021; Miltenberger et al., 2021; McDonald et al., 2021; Cevallos et al., 2019). |
| MRV costs | Environmental monitoring and decision-making technologies; dedicated public funds for improving climate and carbon farming models (Miltenberger et al., 2021; EEB, 2021). |
| MRV heterogeneity | Emphasis on local knowledge and locally appropriate monitoring data to enable systems to be scaled; multidisciplinary teams for MRV and planning; environmental monitoring and decision-making technologies that increase rigour and scope (European Commission et al., 2021; Miltenberger et al., 2021). |
| Baselines and carbon mitigation additionality | ‘Individualised’ baselines and associated local additionality demonstrations, with a discount applied to projects that use cheaper national baselines and additionality and that have greater windfall risk; dynamic baselines that take into account natural risks, climate fluctuations, and human-induced reversals through buffer pools; project-wide due diligence; meta-governance bodies: and blockchain (Cevallos et al., 2019; Miltenberger et al., 2021). |
| Financial, social, or cultural additionality | Multiple funding streams; allowing small projects to apply for group certification of financial, social, or cultural additionality, to enable them to share the administrative and economic burden (while legal certifications must be done separately for each project); diversification of third parties involved in validation and verification (Miltenberger et al., 2021; Cevallos et al., 2019). |
| Permanence | Hybrid action- and results-based models that mitigate against the risk of non-delivery; allowing shorter-term permanence in regulations; ‘no deterioration’ obligations for carbon stocks; only certifying high-quality removals (McDonald et al., 2021; Miltenberger et al., 2021; EEB, 2021; 2022). |
| Enabling co-benefits and limiting negative externalities | General sustainability requirements (in line with the SDGs, Global Standard for Nature-based Solutions or project or regional criteria); transparency and scientific evidence requirements; mandatory stakeholder involvement; lists of permitted/prohibited lands and practices with associated requirements; monitoring tools and policies; multiple payments (Scheid et al., 2023: EEB, 2021; McDonald et al., 2021; Miltenberger et al., 2021). |
While many of the policy responses are either complementary or are alternative methods of achieving the same aim, some key governance tensions emerge, namely:
-
Whether or not to render carbon farming or agricultural emissions mitigation mandatory;
-
Whether or not to integrate voluntary carbon market credits into compliance markets;
-
Whether to make permanence requirements more or less stringent.
The above divisions are foundational questions of the governance of voluntary carbon markets. However, the policy responses do offer clarity on certain aspects:
-
Firstly, local actors must be at the forefront of the creation of voluntary carbon market projects, for their rights as local communities, their knowledge of local ecosystems, and their role in maintaining the project.
-
To enable this, actors (especially the small and family farms that dominate the EU landscape) must receive ongoing guidance to navigate the policies and be supported by administrative and financial incentives. The European Environmental Bureau (2021) defines this distinction as collaboration rather than commodification, i.e., involving “actors across supply chains or in regional partnerships [in the] longer term, and [combining] monetary reward and knowledge exchange” (EEB, 2021, p. 25).
-
This collaboration must involve safeguards for farmers, communities, and their ecosystems, based on scientific expertise, transparency, and land rights laws.
-
Just as safeguards must be built into the system, so must co-benefits be integrated from the outset. This entails pursuing carbon farming not merely as a quantification or commodification of carbon, but rather as a nature-based solution, focusing on integrating social benefits, biodiversity, and resilience through ecosystem restoration (EEB, 2021; 2022).
-
This means harmonising a policy and ecological system that integrate obligations, accounting, and social and environmental objectives.
-
To achieve this at a global level, harmonisation must occur not only within given contexts but also internationally, requiring a strong stance on corresponding adjustments. Leading actors in the VCM field have trialled forms of ‘meta-governance’, such as the Integrity Council for the Voluntary Carbon Market (ICVCM), the International Carbon Reduction and Offset Alliance, and the Offset Quality Initiative (Ahonen et al., 2022; Hickman, 2016). Ethical, independent, and transparent governance at all levels is essential for enabling a just implementation of VCMs.
-
Lastly, voluntary carbon markets must only supplement dominant funding from the public and private sector (outside the carbon market): a successful VCM is one which increases rather than weakens emissions reductions, and which eventually becomes obsolete.
8.9 Conclusion: directions and implications
There is growing research on the role of the financial sector a) in climate finance and funding carbon mitigation technologies (World Bank, 2023) and b) in the financial derivatives market for carbon credits (Spilker and Nugent, 2022). The current state of futures contracts provides an indication of significant faith in voluntary carbon markets, both in terms of higher prices and longevity (Spilker and Nugent, 2022; World Bank, 2023). However, the involvement of financial actors can entail speculative, and at times manipulative, behaviour where real environmental and social impacts are at stake. Furthermore, as we have seen in this chapter, catalysing carbon pricing need not be positive, if prices are too low, projects are ill designed or monitored, offsets replace real mitigations, or accounting and reporting are flawed. Shifts in regulation, such as the International Financial Reporting Standards Foundation’s guidance on climate disclosures for public companies, the Green Claims Directive, Environmental, Social, and Governance regulations, or new mechanisms designed to protect against negligence and fraud have the potential to move the sector in the right direction (World Bank, 2023).
Following negotiations at COP26 and COP27, two regulatory mechanisms are underway: one for accounting for ITMOs, and another for credits generated through Article 6 that can be used for domestic carbon pricing, voluntary action, or results-based climate finance (World Bank, 2023). These will have implications for carbon credits in the agricultural sector, setting out the potential benefits for project owners, and potential international support for contexts worst affected by climate change.
There is still a long way to go to make VCMs reliable, as emerges from our review of the extant literature and existing case studies. Many policy issues need to be addressed. In this regard, Kreibich and Hermwille (2021) pose some of the fundamental questions that policy needs to study, incorporate, and regulate:
-
How do nations align carbon offsetting with NDCs that should already be the “highest possible ambition”?
-
How do we avoid offsets being used to entrench further long-term emissions, e.g., building highly efficient coal power plants?
-
How do we address the risk of lowering emissions based on current levels, but locking in emitting industries and technologies and their consumption?
-
Are offsets being used simply as an excuse for high-carbon activities and taking the attention away from low-carbon innovation (e.g., oil and gas companies continuing to look for new reserves)?
Crucially, in designing and implementing voluntary carbon markets, it is imperative to recognise the transitory, auxiliary nature of these systems. The aforementioned phasing out of carbon credits for renewable energy projects is an example of this, i.e., ceasing to operate when they no longer serve an additional environmental gain. While emissions from ESR sectors in the EU have fallen since 2005, emissions from sectors in the ETS have fallen more steeply (EEA, n.d.). This reinforces the role of voluntary carbon markets operating as an interim, top-up policy in addition to real emissions reductions. Furthermore, their ultimate goal must be environmental impact, not the market itself. Given the challenges of measurement, validity, and integrity explained above, VCMs must be approached with cautious optimism: as mechanisms that can contribute to furthering emissions mitigations, if formally linked to national and transnational obligations, while bringing financial support for farmers, and co-benefits for the surrounding society and ecosystems. However, without international cooperation on linking mechanisms, stringent regulations on quality, putting local communities and ecosystems at the forefront, and on-the-ground support to develop accurate baselines and support for farmers, VCMs risk becoming a mere abstraction of emissions mitigation that can be harmful, both locally and globally.
Policy therefore needs to turn to governance frameworks for community-managed common pool resources, as proposed by Miltenberger et al. (2021, p. 4): “wider inclusion of stakeholders, adaptive management, and fairly allocating cost-benefits… to transform VCMs from market arrangements that abstract GHG values to resource management that integrates their value”. Specifically in the context of agriculture and land use, where nature-based solutions are central (and predicted to lead the market in the near future, as discussed above), practices and structures must rely on an in-depth, systems understanding of the biodiversity, climate, and community relationships that live and breathe around the carbon cycles that can so easily be reduced to a label.
The present chapter is among the first to offer an introduction to the key market, emissions, and policy developments that shape the field at this crucial juncture. Furthermore, we collect and provide two key elements that thus far have not been consolidated: an overview of the nature of lesser-known voluntary carbon markets, and a synthesis of policy recommendations in response to the challenges of VCMs. We therefore hope that this up-to-date guide will support practitioners and policymakers in understanding the current international and European policy and governance landscape, potential and weaknesses of VCMs, and the range of available recommended policy responses. Further research will be needed in the future to build solid theoretical foundations and provide robust empirical evidence to the policy debate in the field.
8.10 Chapter references
Ahonen, H.-M., Kessler, J., Michaelowa, A., Espelage, A., & Hoch, S. (2022). Governance of Fragmented Compliance and Voluntary Carbon Markets Under the Paris Agreement. 10(1). https://doi.org/10.17645/pag.v10i1.4759
Beymer-Farris, B. A., & Bassett, T. J. (2012). The REDD menace: Resurgent protectionism in Tanzania’s mangrove forests. Global Environmental Change, 22(2), 332–341. https://doi.org/10.1016/j.gloenvcha.2011.11.006
Böttcher, H., Zell-Ziegler, C., Herold, A., & Siemons, A. (2019). EU LULUCF Regulation explained: Summary of core provisions and expected effects (FKZ: UM17 41 3070). Oko-Institut e.V.: Institute for Applied Ecology. https://www.oeko.de/fileadmin/oekodoc/Analysis-of-LULUCF-Regulation.pdf
Bravo, F., & Mikolajczyk, S. (2022). The voluntary carbon market dashboard [Data set]. Climate Focus. https://climatefocus.com/initiatives/voluntary-carbon-market-dashboard/
Brunori, A. (2023, March 10). Il mercato volontario dei crediti di carbonio agroforestali: Istruzioni per l’uso. https://www.fidaf.it/index.php/venerdi-culturale-10-03-2023-il-carbon-farming-le-opportunita-e-le-sfide-per-il-settore-agricolo/
Carbon Market Watch. (2016). Rooting out the problem: Preventing LULUCF from undermining the EU’s 2030 target, Carbon Market Watch Policy Briefing. https://carbonmarketwatch.org/wp-content/uploads/2016/02/NC-Rooting-out-the-problem-WEB.pdf
Cevallos, G., Grimault, J., & Bellassen, V. (2019). Domestic carbon standards in Europe. Institute for Climate Economics. https://www.i4ce.org/en/publication/domestic-carbon-standards-in-europe/
Chen, S., Marbouh, D., Moore, S., & Stern, K. (2021). Voluntary carbon offsets: An empirical market study. SSRN. https://doi.org/10.2139/ssrn.3981914
Demeyer, A., Roels, J., Krol, M., Paulsen, H. M., Klinkert, H., Lambrecht, E., Jumshudzade, Z., Coopman, F., Kürsten, E., Sundet, H., & Hørluck Berg, E. (n.d.). Incentivising carbon farming: Policy recommendations from the carbon farming project. Interreg North Sea Region Carbon Farming, European Regional Development Fund, European Union. https://northsearegion.eu/media/18284/whitepaper-carbon-farming-digital.pdf
European Commission. (n.d.-a). Carbon Farming. European Commission. Retrieved 26 May 2023, from https://climate.ec.europa.eu/eu-action/sustainable-carbon-cycles/carbon-farming_en
European Commission. (n.d.-b). Effort sharing 2021-2030: Targets and flexibilities. Retrieved 26 May 2023, from https://climate.ec.europa.eu/eu-action/effort-sharing-member-states-emission-targets/effort-sharing-2021-2030-targets-and-flexibilities_en
European Commission. (2022, November 30). Commission proposes certification of carbon removals [Text]. European Commission. https://ec.europa.eu/commission/presscorner/detail/en/ip_22_7156
European Commission. (2023, March 22). Proposal for a Directive on green claims. European Commission. https://environment.ec.europa.eu/publications/proposal-directive-green-claims_en
European Commission, D.-G. for C. A., Radley, G., Keenleyside, C., Frelih-Larsen, A., McDonald, H., Pyndt Andersen, S., Qwist-Hoffman, H., Strange Olesen, A., Bowyer, C., & Russi, D. (2021). Technical Guidance Handbook—Setting up and implementing result-based carbon farming mechanisms in the EU. Publications Office of the European Union. https://data.europa.eu/doi/10.2834/056153
European Council. (2023, March 29). Fit for 55: Reducing emissions from transport, buildings, agriculture and waste. https://www.consilium.europa.eu/en/infographics/fit-for-55-effort-sharing-regulation/
European Environment Agency. (2022, October 26). LULUCF sector emissions and removals in the EU, by main land use category—European Environment Agency [Data Visualization]. https://www.eea.europa.eu/data-and-maps/daviz/eu-emissions-and-removals-of-1#tab-chart_2
European Environment Agency. (2023, April 18). EEA greenhouse gases—Data viewer—European Environment Agency [Dashboard (Tableau)]. European Environment Agency. https://www.eea.europa.eu/data-and-maps/data/data-viewers/greenhouse-gases-viewer
European Environmental Bureau. (2021). Carbon farming for climate, nature, and farmers: Policy recommendations. https://eeb.org/library/carbon-farming-for-climate-nature-and-farmers/
European Environmental Bureau. (2022a). Certification of Carbon Removals: EEB Policy Recommendations. European Environment Bureau. https://eeb.org/library/certification-of-carbon-removals-eeb-policy-recommendations/
European Environmental Bureau. (2022b, November 30). Certifiably problematic: Commission’s plan for carbon removals. Climate Change. https://eeb.org/certifiably-problematic-commissions-plan-for-carbon-removals/
Eurostat. (2022). Farms and farmland in the European Union—Statistics. https://ec.europa.eu/eurostat/statistics-explained/SEPDF/cache/73319.pdf
Falconi, I. (2023, March 10). Il carbon farming: Le opportunità e le sfide per il settore agricolo. https://www.fidaf.it/index.php/venerdi-culturale-10-03-2023-il-carbon-farming-le-opportunita-e-le-sfide-per-il-settore-agricolo/
Favasuli, S., & Sebastian, V. (2021, June 10). Voluntary carbon markets: How they work, how they’re priced and who’s involved. S&P Global. https://www.spglobal.com/commodityinsights/en/market-insights/blogs/energy-transition/061021-voluntary-carbon-markets-pricing-participants-trading-corsia-credits
Food and Agriculture Organization. (n.d.). Mitigating climate change: Climate Smart Agriculture Sourcebook. Food and Agriculture Organization of the United Nations. Retrieved 26 May 2023, from https://www.fao.org/climate-smart-agriculture-sourcebook/concept/module-a2-adaptation-mitigation/chapter-a2-3/en/
Food and Agriculture Organization of the United Nations (FAO). (2021). Emissions due to agriculture: Global, regional and country trends, 2000-2018, FAOSTAT Analytical Brief 18. Food and Agriculture Organization of the United Nations (FAO). https://www.fao.org/3/cb3808en/cb3808en.pdf
Greenfield, P. (2023, January 18). Revealed: More than 90% of rainforest carbon offsets by biggest certifier are worthless, analysis shows. The Guardian. https://www.theguardian.com/environment/2023/jan/18/revealed-forest-carbon-offsets-biggest-provider-worthless-verra-aoe
Hickman, T. (2016). Rethinking authority in global climate governance: How transnational climate initiatives relate to the international climate regime. Routledge.
Kim, R., & Pierce, B. C. (2018). Carbon offsets: An overview for scientific societies. https://www.cis.upenn.edu/\~bcpierce/papers/carbon-offsets.pdf
Kotsialou, G., Karlygash, K., & Laing, T. (2022). Blockchain’s potential in forest offsets, the voluntary carbon markets and REDD+. Environmental Conservation, 49(3), 137–145. https://doi.org/10.1017/S0376892922000157
Kreibich, N., & Hermwille, L. (2021). Caught in between: Credibility and feasibility of the voluntary carbon market post-2020. Climate Policy, 21(7), 939–957. https://doi.org/10.1080/14693062.2021.1948384
Lee, H., Calvin, K., Dasgupta, D., Krinner, G., Mukherji, A., Thorne, P., Trisos, C., Romero, J., Aldunce, P., Barrett, K., Blanco, G., Cheung, W. W. L., Connors, S. L., Denton, F., Diongue-Niang, A., & Dodman, D. (2023). Synthesis Report of the IPCC Sixth Assessment Report (AR6): Summary for Policymakers. Intergovernmental Panel on Climate Change (IPCC). https://www.ipcc.ch/report/ar6/syr/downloads/report/IPCC_AR6_SYR_LongerReport.pdf
McDonald, H., Frelih-Larsen, A., Lóránt, A., Duin, L., Pyndt Andersen, S., Costa, G., & Bradley, H. (2021). Carbon farming: Making agriculture fit for 2030. Policy Department for Economic, Scientific and Quality of Life Policies, European Parliament. https://www.europarl.europa.eu/RegData/etudes/STUD/2021/695482/IPOL_STU(2021)695482_EN.pdf
Michaelowa, A., Shishlov, I., & Brescia, D. (2019). Evolution of international carbon markets: Lessons for the Paris Agreement. WIREs Climate Change, 10(6). https://doi.org/10.1002/wcc.613
Miltenberger, O., Jospe, C., & Pittman, J. (2021). The Good Is Never Perfect: Why the Current Flaws of Voluntary Carbon Markets Are Services, Not Barriers to Successful Climate Change Action. Frontiers in Climate, 3. https://doi.org/10.3389/fclim.2021.686516
Nabuurs, G.-J., Mrabet, R., Abu Hatab, A., Bustamante, M., Clark, H., Havlík, P., House, J. I., Mbow, C., Karachepone, N. N., Popp, A., Roe, S., Sohngen, B., & Towprayoon, S. (2022). Agriculture, Forestry and Other Land Uses (AFOLU). In IPCC, 2022: Climate Change 2022: Mitigation of Climate Change. Contribution of Working Group III to the Sixth Assessment Report of the Intergovernmental Panel on Climate Change. Cambridge University Press. https://www.ipcc.ch/report/ar6/wg3/downloads/report/IPCC_AR6_WGIII_FullReport.pdf
Nogues, M., Husson, M., Grousset, P., Reynders, S., & Soussana, J.-F. (2021). Framework of possible business models for the implementation of a carbon demonstrator. INRAE; LISIS; NATAÏS. https://dx.doi.org/10.15454/fc2z-7d70-EN
Roman-Cuesta, R. M., & Borghesi, S. (n.d.). A post-COP26 overview of the voluntary carbon market (Research Project Report Issue 2022-July 2022). Florence School of Regulation, Climate Area, European University Institute.
Scheid, A., McDonald, H., Bognar, J., & Tremblay, L.-L. (2023). Carbon farming co-benefits: Approaches to enhance and safeguard biodiversity. Ecologic Institute and Institute for European Environmental Policy. https://ieep.eu/publications/carbon-farming-co-benefits-approaches-to-enhance-and-safeguard-biodiversity/
Shen, J. J., & Singh, J. (2022, September 19). Mapping the Voluntary Carbon Market. Understory. https://www.theunderstory.io/mapping-the-voluntary-carbon-market/
So, I. S., Haya, B. K., & Elias, M. (2023). Voluntary registry offsets database (7.1) [Excel]. Berkeley Carbon Trading Project. https://gspp.berkeley.edu/research-and-impact/centers/cepp/projects/berkeley-carbon-trading-project/offsets-database
Spilker, G., & Nugent, N. (2022). Voluntary carbon market derivatives: Growth, innovation & usage. Borsa Istanbul Review, 22(2), S109–S118. https://doi.org/10.1016/j.bir.2022.11.008
Streck, C. (2021). How voluntary carbon markets can drive climate ambition. Journal of Energy & Natural Resources Law, 39(3), 367–374. https://doi.org/10.1080/02646811.2021.1881275
Tang, K., Kragt, M. E., Hailu, A., & Ma, C. (2016). Carbon farming economics: What have we learned? Journal of Environmental Management, 172, 49–57. https://doi.org/10.1016/j.jenvman.2016.02.008
Taskforce on scaling voluntary carbon markets. (2021). Scaling voluntary carbon markets: A blueprint. Final report. Taskforce on scaling voluntary carbon markets. https://custom.cvent.com/8644FD66069649369747A352DBAB07C3/files/1a7a383d7f314beb87c934c1060b30e9.pdf
World Bank. (2022). State and trends of carbon pricing 2022. http://hdl.handle.net/10986/37455
World Bank. (2023). State and trends of carbon pricing 2023. http://hdl.handle.net/10986/39796
Yu, E. P., Van Luu, B., & Huirong Chen, C. (2020). Greenwashing in environmental, social and governance disclosures. Research in International Business and Finance, 52(101192). https://doi.org/10.1016/j.ribaf.2020.101192
Footnotes
Land use change involves the conversion of land to produce food for human consumption or to produce animal feed.
12 Established in 1992 during “United Nations Conference on Environment and Development” in Rio De Janeiro, and entered into force in 1994 to support international negotiations to combat climate change. ↩︎
This is in line with the 6th IPCC report findings, which stated that the Agriculture, Forestry and Other Land Use (AFOLU) sector accounted for 13-21% of global total anthropogenic GHG emissions in 2010-2019 (medium confidence) (Nabuurs et al., 2022). ↩︎
14 “Agriculture, Forestry and Other Land Use (AFOLU) and Land Use, Land Use Change and Forestry (LULUCF) are categories of activities defined by IPCC in the context of emissions accounting. The AFOLU category includes LULUCF and Agriculture. In the context of mitigation, ‘Agriculture’ – in accordance with IPCC terminology – includes emissions from enteric fermentation, manure management, rice cultivation, prescribed burning of savannas and grassland, and from soils (i.e., agricultural emissions). Emissions related to forest and other land use are covered under LULUCF.” (FAO, n.d.) https://www.fao.org/climate-smart-agriculture-sourcebook/concept/module-a2-adaptation-mitigation/chapter-a2-3/en/ ↩︎
15 "4.1 (1.7–6.7) GtCO2-eq yr–1 (up to USD100 tCO2-eq–1) from cropland and grassland soil carbon management, agroforestry, use of biochar, improved rice cultivation, and livestock and nutrient management.” (Nabuurs et al., 2022: ) ↩︎
Current Member State targets: https://climate.ec.europa.eu/eu-action/effort-sharing-member-states-emission-targets/effort-sharing-2021-2030-targets-and-flexibilities_en#:~:text=The Effort Sharing Regulation establishes,agriculture%2C small industry and waste. ↩︎
Austria, Belgium, Denmark, Finland, Ireland, Luxembourg, the Netherlands, Malta and Sweden. Iceland and Norway are also eligible as they have agreed with the EU to implement the Effort Sharing Regulation (European Commission, n.d.). ↩︎
Malta can use allowances equivalent to up to 7% of their Effort Sharing emissions in 2005. This limit is 4% for Ireland,Luxembourg, and Iceland, and 2% for Belgium, Denmark, Finland, the Netherlands, Sweden, and Norway. ↩︎